You’re likely tracking all your global metrics to keep apprised of your business’ performance – ARR, churn, LTV, retention rates, etc. However, if high-level metrics are all you’re checking, you’re potentially missing trends in your data that hold the secret to unlocking more growth.
Segmentation allows you to peel the onion layer by layer to answer hundreds of questions about your customers. Questions like:
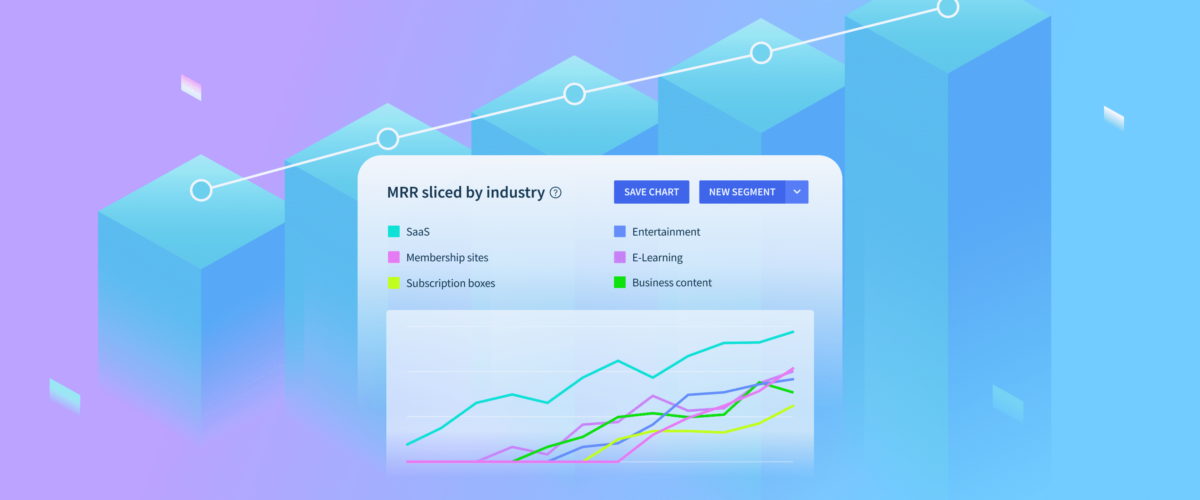
- Which marketing channel brings in the most MRR? Which plan?
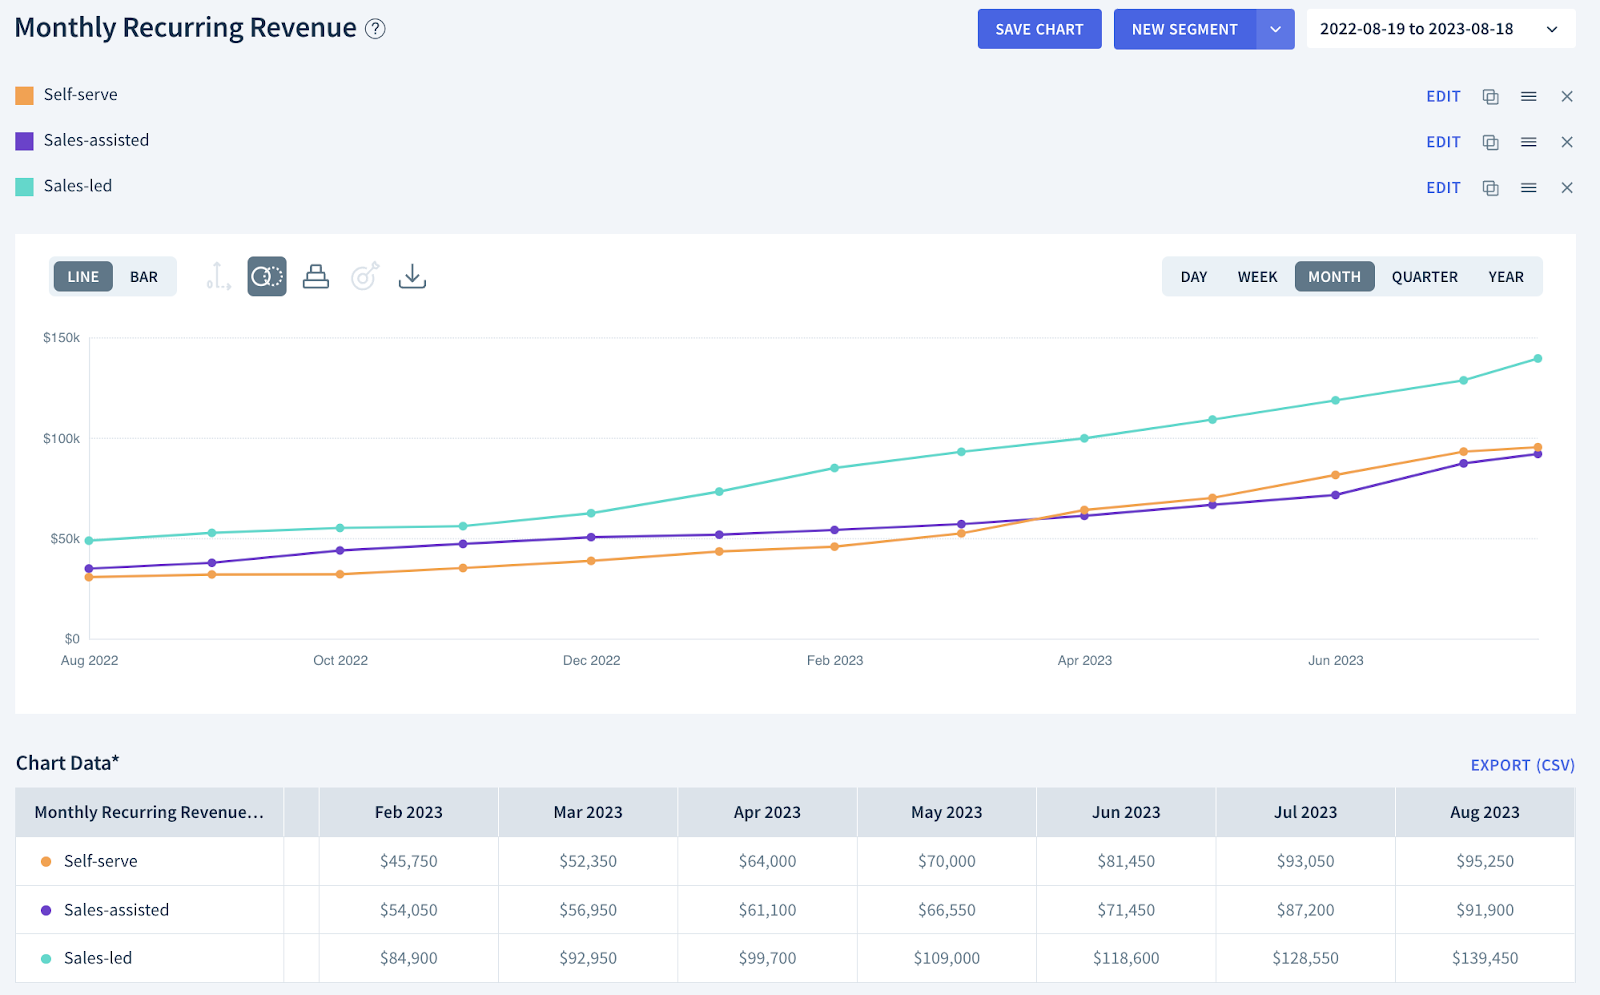
- How does my PLG motion compare to Sales-led in terms of revenue or retention?
- Do customers from particular verticals have a higher LTV? Churn?
Anyone can use segmentation in ChartMogul to analyze subscription data without needing a background in business intelligence, SQL, or direct access to data. You can empower your whole team to make more informed decisions with subscription data.
Segmentation informs strategy
Now that you’ve got the power to discover these insights, you can use them to inform your strategy and reach your next revenue targets.
If you know which marketing channel contributes the most MRR to your business, you know where to allocate your spend.
Which verticals have higher retention rates? Now you can tailor your marketing campaigns, communication, and product offerings to resonate with the distinct characteristics of those verticals.
By segmenting your subscribers, you can also identify segments with high churn rates and delve deeper into the reasons behind their cancellations. Enabling you to implement focused strategies to reduce churn.
The list goes on, now you just have to prioritize based on impact. Let’s look at a couple examples in greater detail.
Are your plans equally profitable?
Segmenting ARR by subscription plan provides you with granular insights into the revenue generated by each plan. This allows you to understand which plans are the most popular, which contribute the most revenue, and how different plans perform over time.
Looking at your total ARR is one thing, but it won’t give you much of a clue about what could be next for your company (whether you’re on track to PMF).
On the chart below we can see that our Enterprise plans are greatly outperforming our Growth and Starter plans. Not only does this plan have a higher ARPA, it’s growing faster than the other types of plans. This is where we as a company should be spending our efforts – where we have product-market fit.
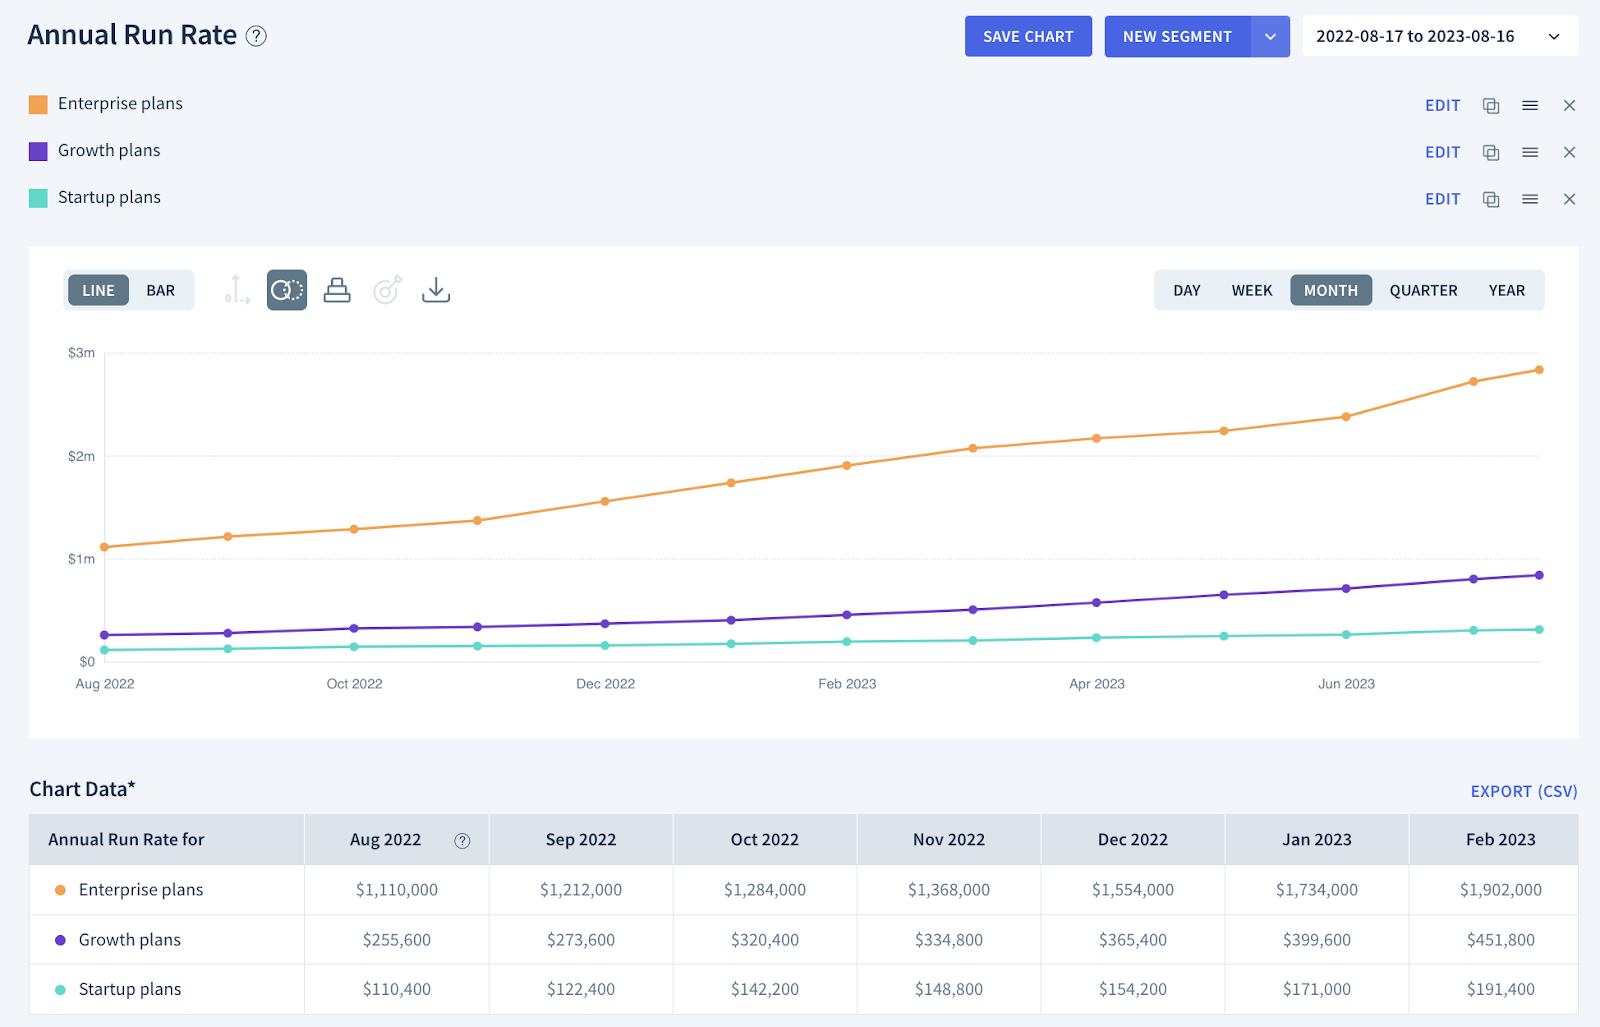
With insights into the revenue generated by each plan, you can fine-tune your pricing strategies.
Startup plans just aren’t generating the kind of revenue that we’d expect, so there’s clearly a mismatch between the price and value our customers are receiving.
Use this segmentation analysis as a springboard for further analysis. We can discuss the pricing with customers and dig into the churn reasons.
Whatever the case, it’s clear we need to make adjustments to better align with customer preferences.
How should you spend your marketing budget?
Now that we know which plan is most profitable, we can take it a level deeper and find out how best to acquire more of these customers.
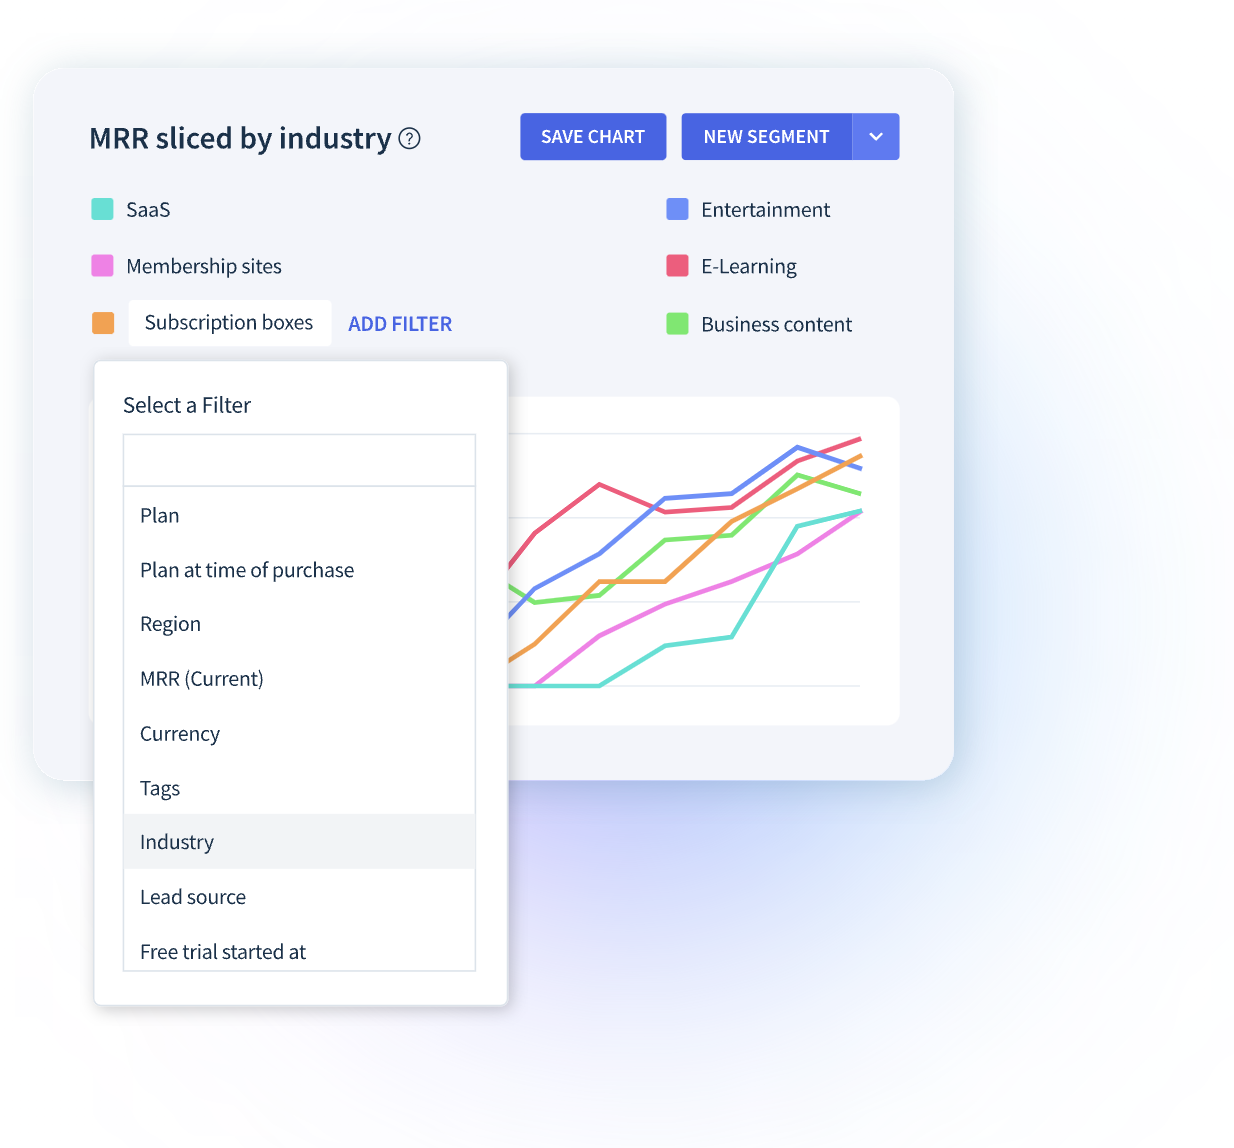
ChartMogul comes pre-loaded with dozens of filters like plan, region, currency, and more. You can also pipe in additional data with our Enrichment API or Zapier. Here I’ve added a marketing channel custom attribute to each customer record. I’ll use that as the basis for my analysis.
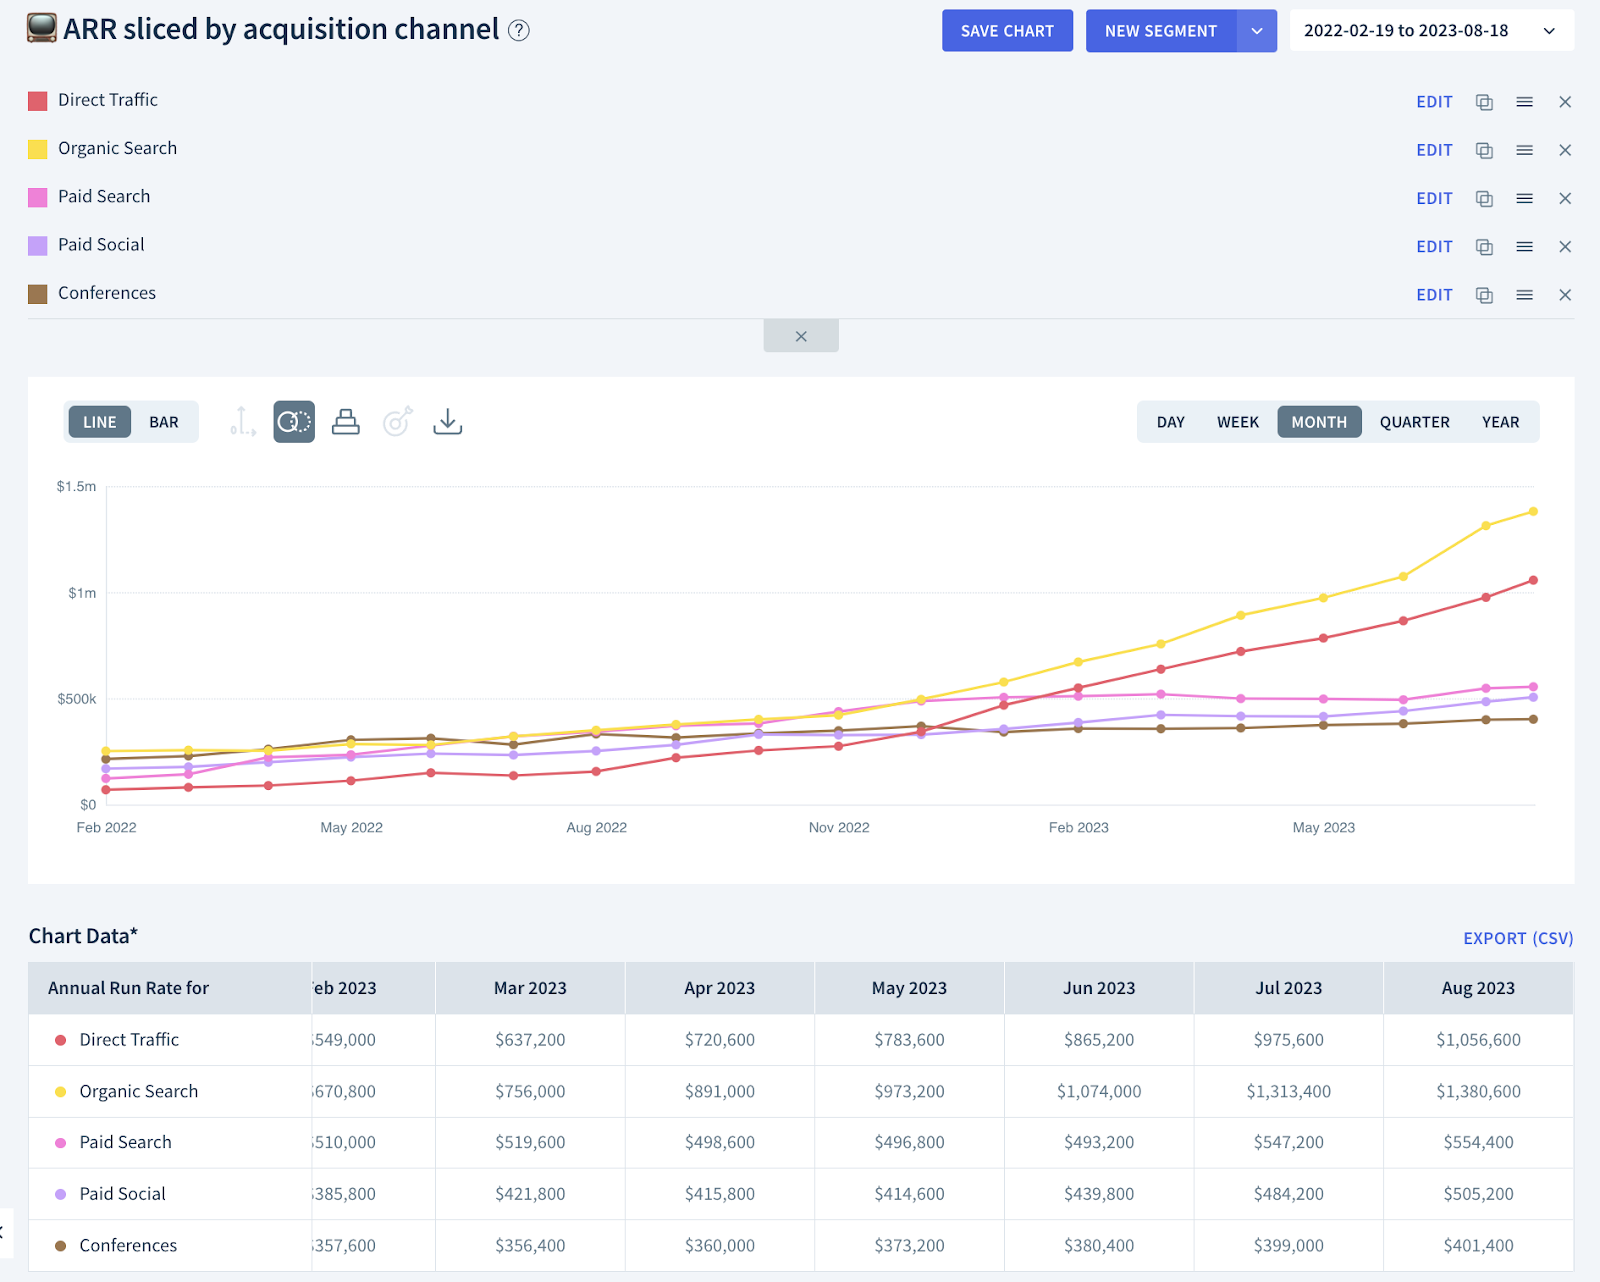
You can see that Organic search is our most successful marketing channel. It’s clear that the investment in content marketing and SEO is really paying off for us.
We do have some success with conferences and paid social, however, it would make sense to reevaluate our spend and strategy. We might not be reaching the right audience.
How much revenue does direct sales contribute over self-serve?
A self-serve or product-led motion can play a crucial role in enhancing the customer experience, driving growth, and optimizing operational efficiency.
Users can take control of their experience and explore your product at their own pace without complex onboarding or needing to interact with a sales rep. However, your customers might prefer a little guidance from the team or the complexity of your product simply necessitates it.
If you started product-led and you’ve started adding a sales motion, or vice-versa, segmenting your MRR by these two approaches can help you gain insight into the efficacy of your go-to-market model and help you determine how best to allocate resources in order to reach your goals.
Add context to your customer data
To make the most of Segmentation you need to enrich the customer data in your account. You can do this in the following ways:
- Manually tagging customer accounts in ChartMogul – if you have customers that you want to tag with specific information, you can do this with tagging.
- Using our new Enrichment API – Allows you to programmatically add metadata to your customer records in ChartMogul, which can then be used with Segmentation. This allows you to pipe in data from external sources such as Salesforce, Hubspot, Intercom, etc. or a data warehouse solution, and use it to segment your metrics in ChartMogul. (Read the API documentation here).
- Sending custom attributes to ChartMogul from Zapier. Zapier connects to thousands of applications and is super easy to set up.
Segmenting your subscription data with filters or custom attributes can help you identify the trends that hold the secret to maximizing efficiency and unlocking future growth.
Get started with ChartMogul today.