
Established in 2010, Buffer hardly needs an introduction. An early entrant to the SaaS field, the company has pioneered a number of fields that are now commonplace in the industry — content marketing, the transparent startups movement, and remote work.
Buffer’s mission is to empower their customers to build their brand and engage their audience on social media.
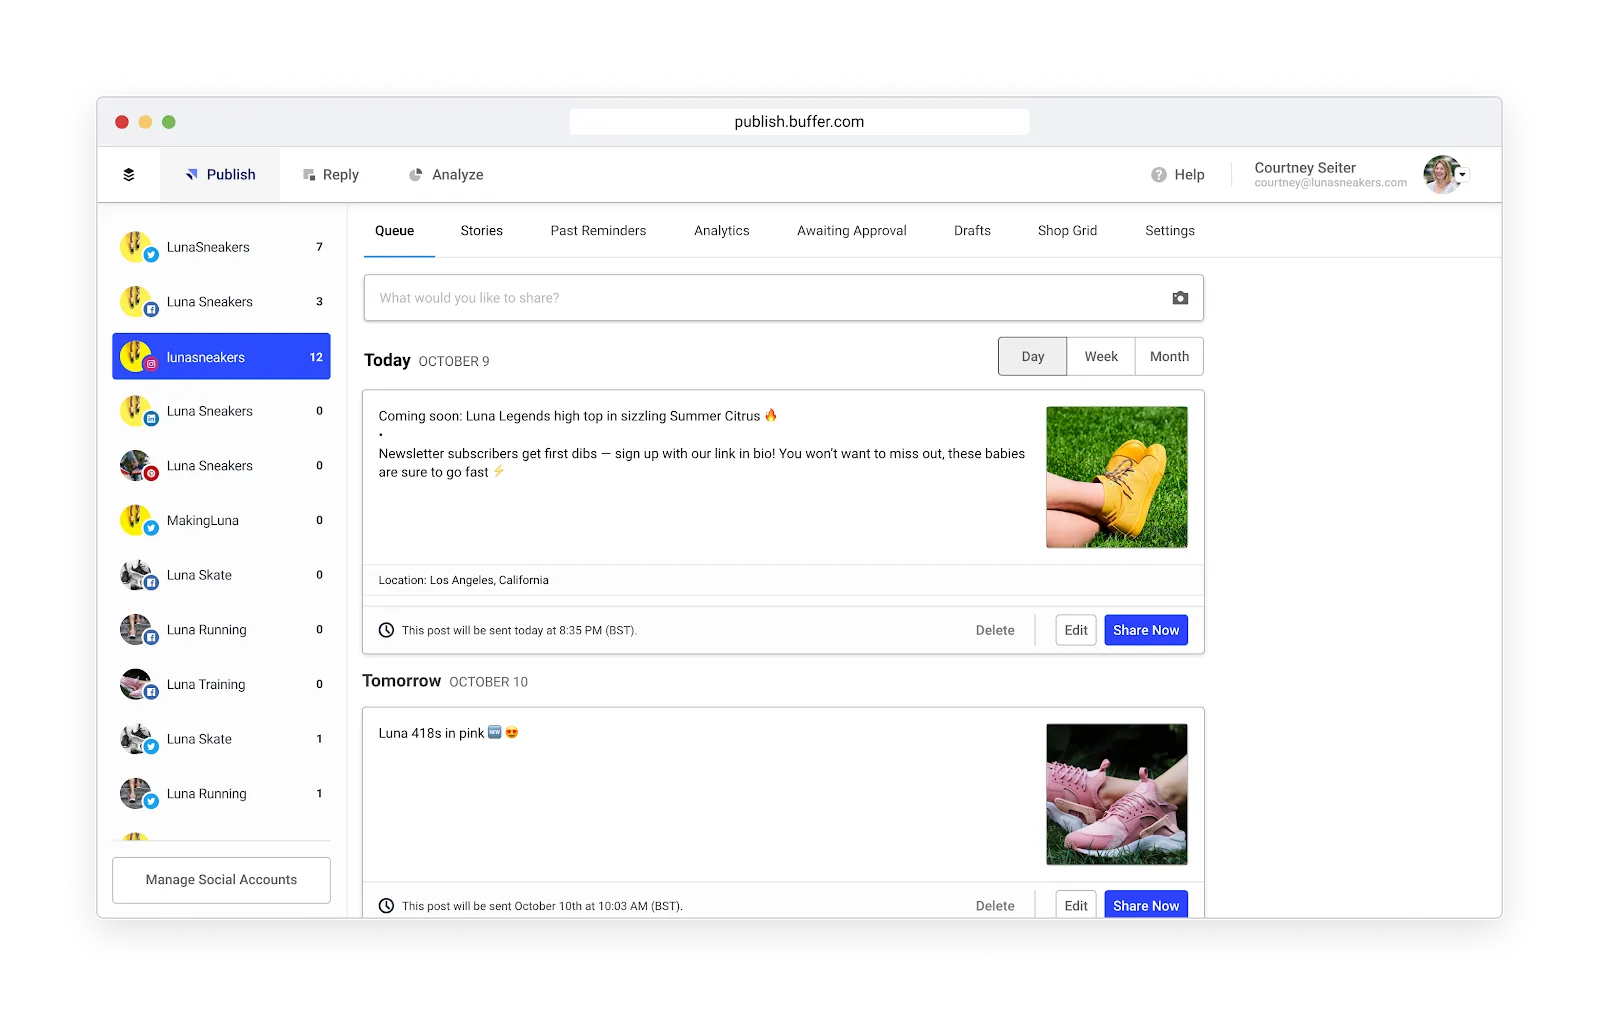
To do that, they provide 3 products to their customers:
- Publish: The original product that helps people schedule and publish on social media channels
- Reply: Shared inbox to reply to conversations on social channels
- Analyze: Analytics and reporting for social media
We spoke to Buffer’s CEO Joel Gascoigne about his experience building Buffer and the role and place subscription data plays for the company.
The Challenge: Buffer was amassing “reporting debt”
For the first 2-3 years of Buffer’s existence, Joel and his team did not need a specialized solution for subscription analytics.
The volume of transactions was low enough that they could get by using database queries to calculate their MRR, churn, and even to perform some cohort analysis.
However, as the company grew, their systems started to fail all the time, prompting the team to re-think their approach and look for a scalable solution.
In 2014, Buffer started using both Baremetrics and Looker. While Baremetrics was fulfilling the desire for public transparency, internally the team was using Looker almost exclusively to track and report revenue metrics.
Baremetrics was limiting in the sense that they could only analyze their revenue from Stripe, while the team was already using mobile and custom invoicing to bill and collect payments.
That’s why they decided to adopt Looker for their internal analytics needs. It helped them overcome some of the initial challenges, but over time it started creating other problems.
On top of requiring a separate 2-person team to support this homegrown solution, they also had a hard time collecting and trusting the data in Looker.
It felt like a constant battle to get all the data in and it was also costing us a lot of time. I would often message (Buffer data scientist) Julian to ask “Why did our MRR number for this or that change?”
Joel admits that it probably took him and the team too long to realize they needed to make a change in their analytics set up.
Early in 2019, I had an epiphany moment. I realized we had better data in the first 2-3 years of the company when we were using improvised solutions, than with our sophisticated business intelligence platform. How was that possible?
The unreliable data was slowing the whole team down
This is when Joel realized that these issues were affecting the whole team — including how the product was evolving.
We increasingly started to feel like we were running blind. Because of the challenges we were struggling with, we constantly had to rely on assumptions for important decisions about the product and it was starting to tell.
All that is a bit surprising, provided Buffer’s team was drowning in data — Joel shared with us that between their paying customers, the free plan, and the 14-day trial, they were getting about 350 thousand monthly active users (MAU) at the time.
That didn’t help deliver a clearer picture of how the business was progressing.
MRR numbers were changing all the time. I realized we had a moving target for the most important metric in our company.
The setup was affecting the team culture
Initially, Joel and his team were hoping that using Looker would empower the team to use their subscription data to gain insight and make better decisions about the business.
However, this didn’t prove true and it put the whole organization in a situation where they required constant assistance from the data team.
At some point, I noticed this was producing a change in our team culture. More and more people just started to assume that they “were not good at data”.
The Solution: Invest in a revamped data infrastructure
Joel told us that part of the reason why it took them so long to decide to move away from Looker, was that there was some apprehension by the team to abandon a solution that they spent so much time building.
In hindsight, I think that waiting 4-5 years, when things were clearly not working out, was too long. In the end, I had to step in and make a call for the best of the (whole) team.
When they started building their setup, the analytics niche wasn’t so robust, so they had to rely on their own solutions. This time around, Joel realized he would need to take a step back and adopt a “zero budget” mentality.
I asked myself “If we were starting today, what would we put in place?” So we started researching and we saw that while our peer companies were using a mix of homegrown and specialized tools, many new startups were adopting the likes of Segment, Mixpanel, and ChartMogul from the get-go. I wanted to be using the tools of the future and always ready to upgrade and switch things out, rather than getting behind and building up debt. That would make us less effective, and also less attractive to people joining the team.
Joel had what he calls “an honest conversation” with Buffer’s CTO Dan. At that meeting, they decided they had to completely overhaul their analytics setup.
One interesting thing that Joel shared with us, was that he realized implementing these software tools would require a large investment, but he consciously made that decision:
I would gladly spend $100,000 on a tool if that would allow me to avoid hiring. A smaller team allows us to be more productive and move quicker.
Pick each piece individually
Joel also knew that using different tools for data pipeline management, product engagement analytics, and subscription analytics, would allow them to pick the best tool for each piece of the setup.
The Buffer team chose Segment as the basis of their data setup. It collects data and feeds it into the other tools they’re using.
Mixpanel “lives” on top of Segment and helps the team track engagement with the product.
ChartMogul brings together subscription data from Stripe, mobile, and custom invoicing and allows Joel and the team to understand where the business is going.
This setup also makes it easy to build up the system and integrate it with our tools that the Buffer team is using for support (Zendesk), in-app messaging (Appcues), and email (Customer.io).
Build internally?
For a while, Joel thought the best way would be to build their own tool to track revenue and other key subscription metrics.
But he realized that would require not just engineering resources, but answering hard questions that weren’t where their strength lies.
Questions like “What MRR formula should we use?” led Joel to realize they need to focus on creating value for their customers and “outsource” areas where they’re not experts.
The Result: Reigniting growth thanks to a better understanding of data
The Buffer team has already been able to drive strategic changes to their business thanks to their new approach towards analyzing and using their data.
Early in 2018, MRR growth was starting to slow down and that provoked Joel to start thinking about the best way to grow from $16m in ARR where they were at that moment to $50m over time.
He knew it was not feasible to expect that the next 10x growth in revenue would come by adding another 700,000 customers (~10x the number they had at the time).
That’s when he realized they would need to find a new way to grow. Looking at their subscription data allowed them to find the way forward.
That’s when the team made a decision to focus on driving rapid ARPA growth.
Joel shares that at the time, the Average Revenue per Account (ARPA) was only $18-19. The team set a goal of growing this number in order to start growing and investing in developing the products again.
To grow their ARPA, they chose two specific strategic directions:
- They examined their pricing and packaging and updated it in a way that allowed them to support their customers in a more meaningful way. For example, their lowest plan went from $10 to $15/mo.
- They expanded the product offering by adding Reply and Analyze to their suite of social media management tools.
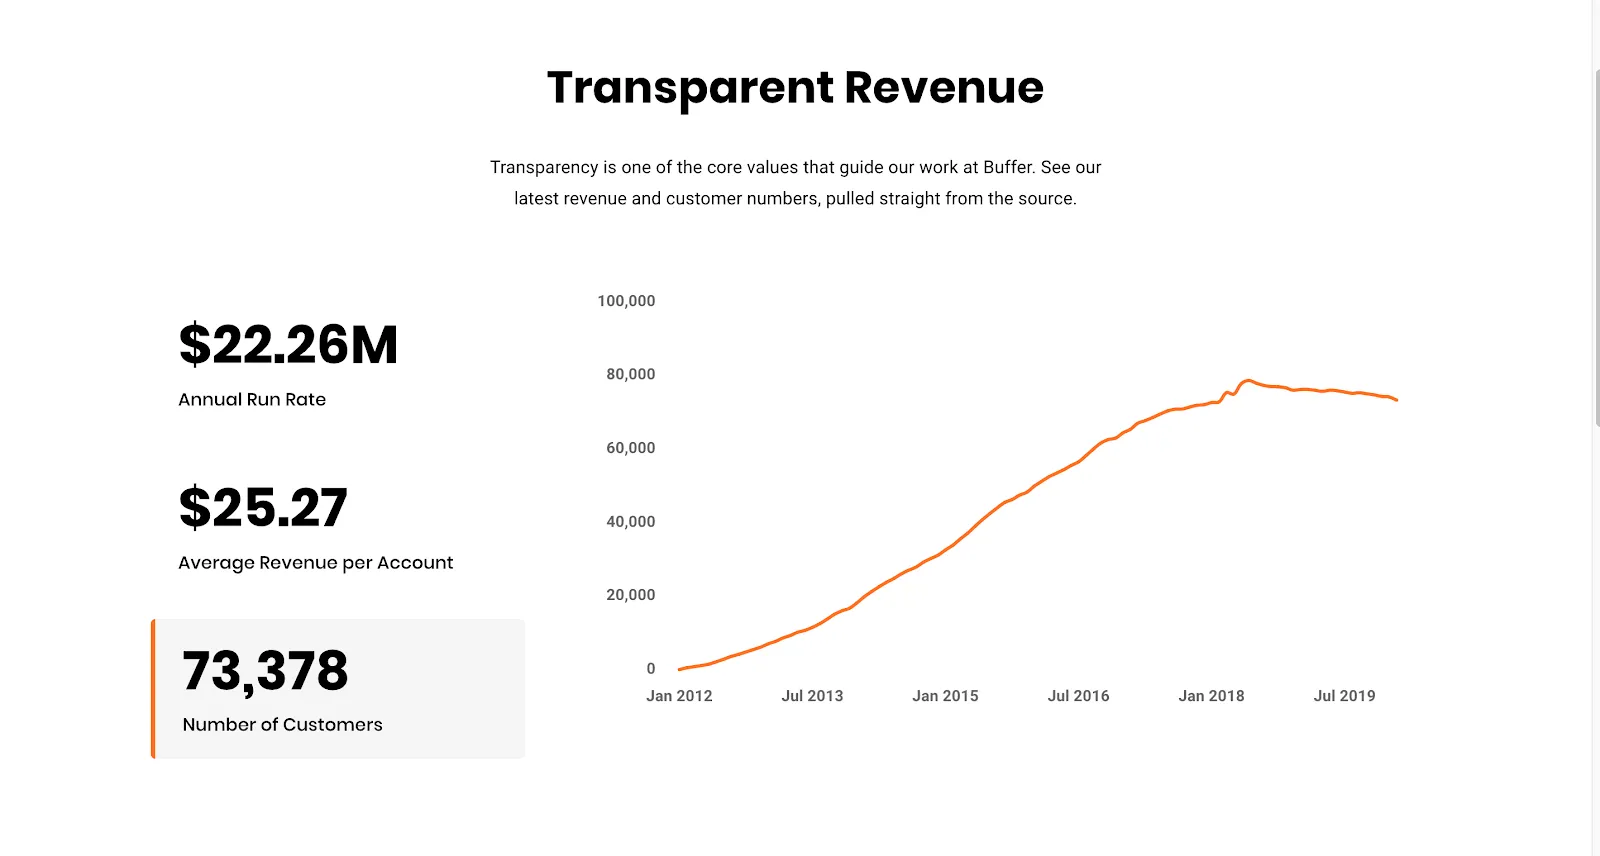
Today, Buffer’s average revenue per customer stands at around $25.
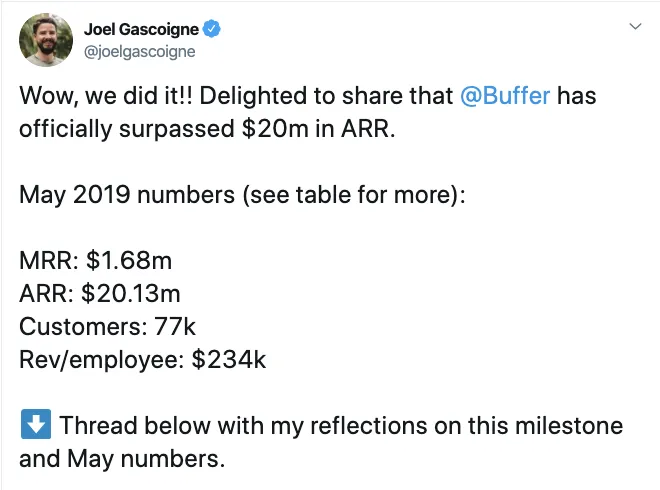
While the number of paying customers has stayed more or less flat at around 75,000, this initiative has allowed the team to sustain growth and reach $20 million in ARR.
2 different North Star metrics?
When we first asked the Buffer team about their North Star metrics, people on the product team mentioned ARPA.
Joel also looks at ARPA but also thinks about it in the context of Buffer’s total MRR.
I see ARPA as one of the components of MRR (ARPA * Customers = MRR). Within that formula, we consciously decided to ignore the "Customers" variable and focus entirely on the ARPA variable, to drive MRR. So the team was focused on that, which is great, and of course, I'm always looking at MRR. At the end of the day, that's our revenue and drives a lot of other strategic decisions such as hiring and other spend.
He does, however, admit that MRR is perhaps not the most meaningful way to look at the business.
Telling product managers to “grow MRR” is not actionable. Improving our analytics set up allowed us to identify a solid strategy to implement.
ChartMogul has been instrumental in that. Joel shared with us that he has 3 tabs that are constantly opened in his browser — one is his calendar, a second one for one of the internal team communication tools they use, and finally one with their ChartMogul dashboard.
Use your subscription data if you don’t want to fall behind
Over the last decade of operating in SaaS, Joel has seen the industry grow increasingly sophisticated.
He believes this is a characteristic that is going to stay and exert an even stronger effect on the industry.
He calls subscription data “the backbone” of SaaS businesses — because it is the only true source of insight of what is and isn’t working.
It is going to become a competitive advantage to have a deeper knowledge of your subscription data.
Joel argues that companies that do not develop a culture of understanding and using that data in a meaningful way are bound to fall behind.
We’re at the point where if you’re starting a SaaS company, you need a tool like ChartMogul from Day 1.