
“When you stop growing, you start dying” said William S. Burroughs. That’s just as true for SaaS startups as it is for life. Growth is key to building any successful SaaS startup.
So, what is a good growth rate for a SaaS subscription business? In this post, we analyze anonymized and aggregated data from ChartMogul to find the answer. Later, we provide an overview of segments, and share insights on how they can help you unlock your startups’ growth.
*Data for this post has been taken from the latest Growth and Benchmarks reports.
- What is a good growth rate?
- Growth rate benchmarks
- SaaS growth milestones — how fast should you grow?
- How to calculate SaaS growth rate
- Growth factors
- Unlocking growth using segmentation
SaaS growth rates in 2023
It depends on the stage of your business. Growth rates are higher in the early stages. As companies mature, their growth rate slows down.
- Best-in-class SaaS businesses double their annual recurring revenue (ARR) each year.
- Median SaaS businesses grow about 30% each year.
Lots of factors are responsible, but we’ll get to that in a bit.
For now, let’s look at annual and monthly SaaS growth rates.

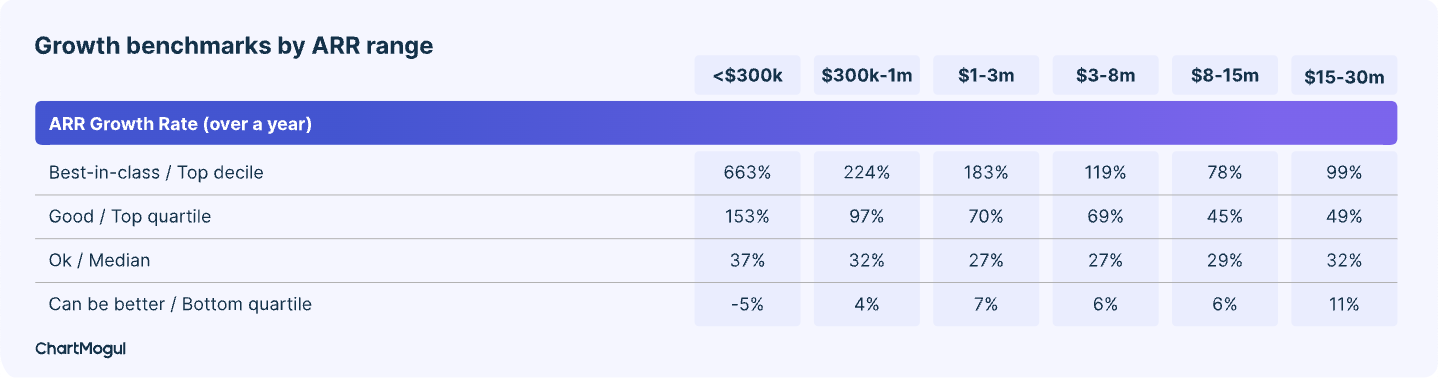
Annual SaaS growth rates by ARR range
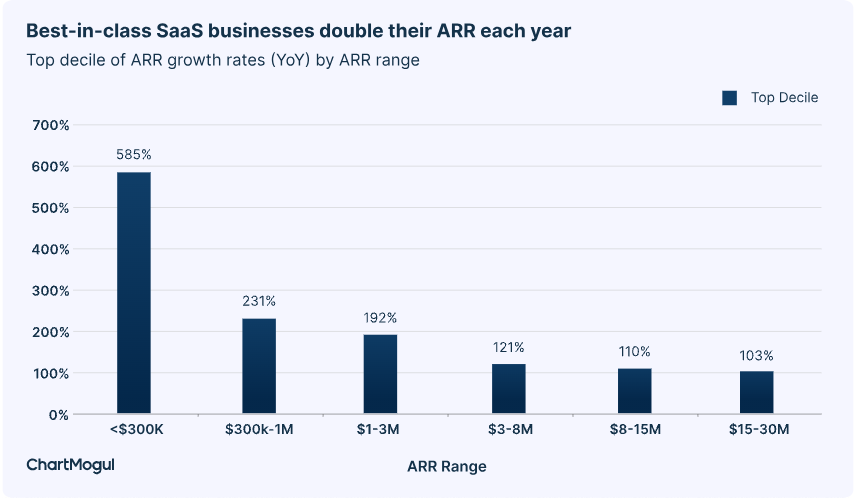
Best-in-class SaaS businesses double their revenue.
The chart below shows just how explosive (585%) revenue growth can be for new SaaS businesses under the $300K ARR range. This mad rush to product market fit (PMF) tapers off as they cross into the $1M+ ARR range.
The top decile of SaaS businesses with ARR in the range of $1-3M grow at 192% annually.
In the $3-8M ARR segment: 121%.
The top quartile of SaaS businesses grow around 60-70% annually, while the median SaaS business grows around 30% annually.
The fastest startups outgrow others multiple times over. As you can see, the dispersion in growth is highest in the early stages. This is expected, as some startups find product-market fit (PMF) and start scaling, while others keep searching for it.
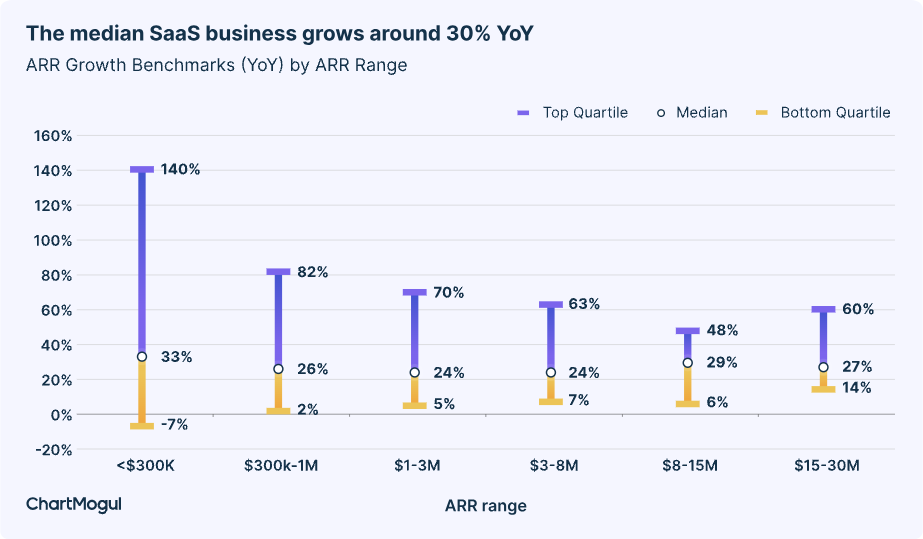
As you can see, the dispersion in growth is highest in the early stages. The fastest startups outgrow slower ones multiple times over. This is expected, as some startups find product-market fit (PMF) and start scaling, while others keep searching for it.
Monthly SaaS growth rates by ARR range
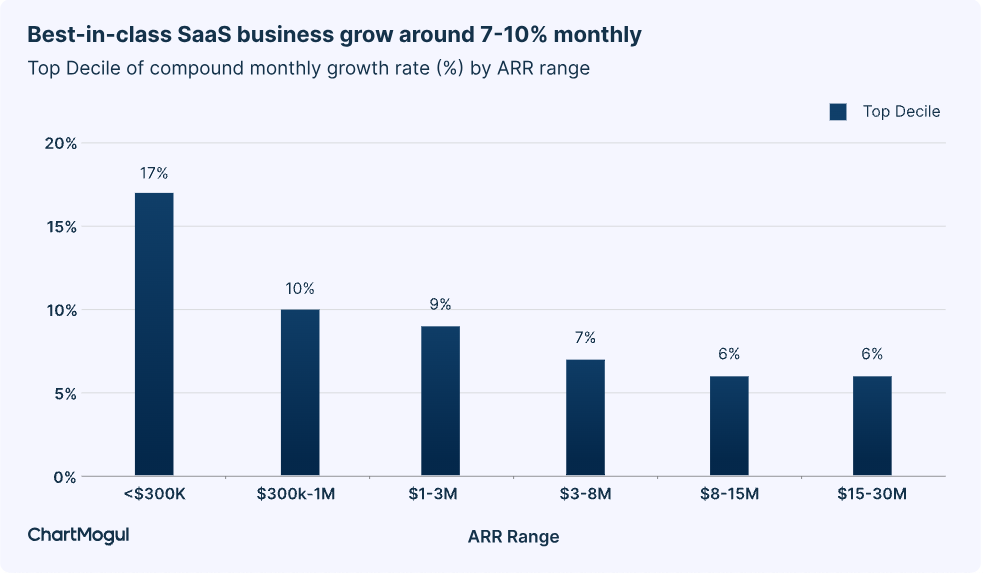
These charts show what kind of growth rate numbers SaaS businesses need to hit on a monthly basis to reach those yearly figures shown above.
The top decile of SaaS startups grow over 10-17% per month when starting out.
Once they cross the $3M ARR milestone, growth settles around 6-7% per month.
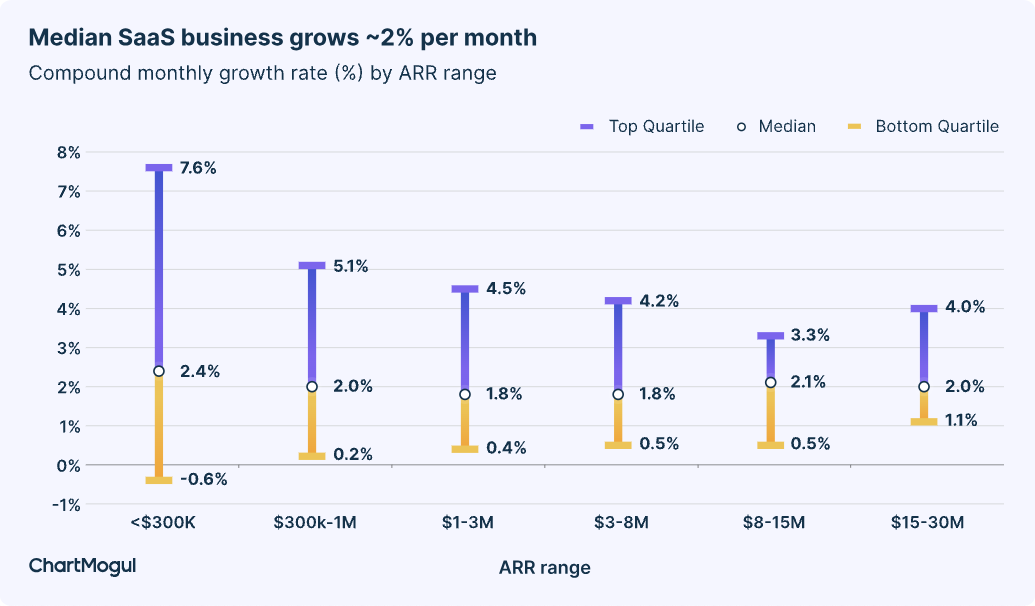
The median SaaS business grows around 2-2.5% per month throughout its lifecycle.
The top quartile of SaaS businesses initially grow around 5-7% per month but then as they mature, growth settles around 3-5% per month.
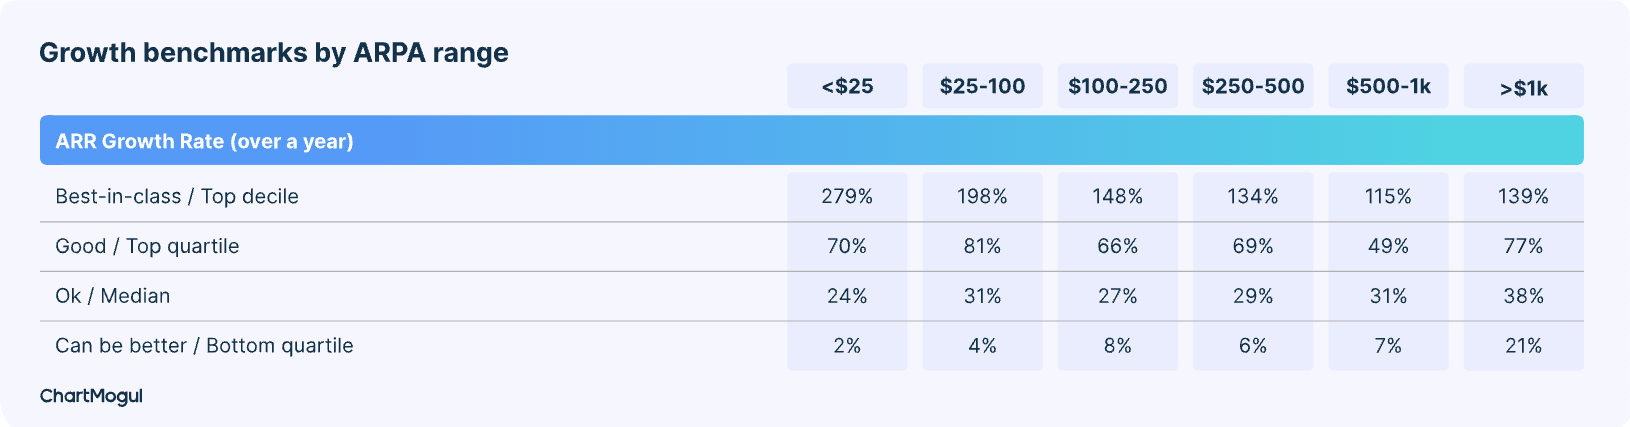
SaaS growth rate benchmarks for 2023
Where does your growth rate stand amongst the SaaS landscape? Use these two charts to quickly benchmark your numbers against 2,100+ SaaS businesses by ARR and ARPA range.
*Data is sourced from two separate reports. You may find variances (vs. above charts) due to a different number of data sources and time periods. All data was sourced in 2023.
SaaS growth milestones — how fast should you grow?
Depending on what stage you’re in you might bet set on hitting your first $1M, or $10M ARR.
Are you on track, lagging behind, or leaving the competition in the dust?
The charts in this section show how long it takes SaaS businesses to reach their revenue milestones..
*Note that this data naturally has survivorship bias. It’s because only a small percentage of startups grow and hit a particular revenue milestone (Only 13% of SaaS startups reach $10M ARR even after 10 years in existence).
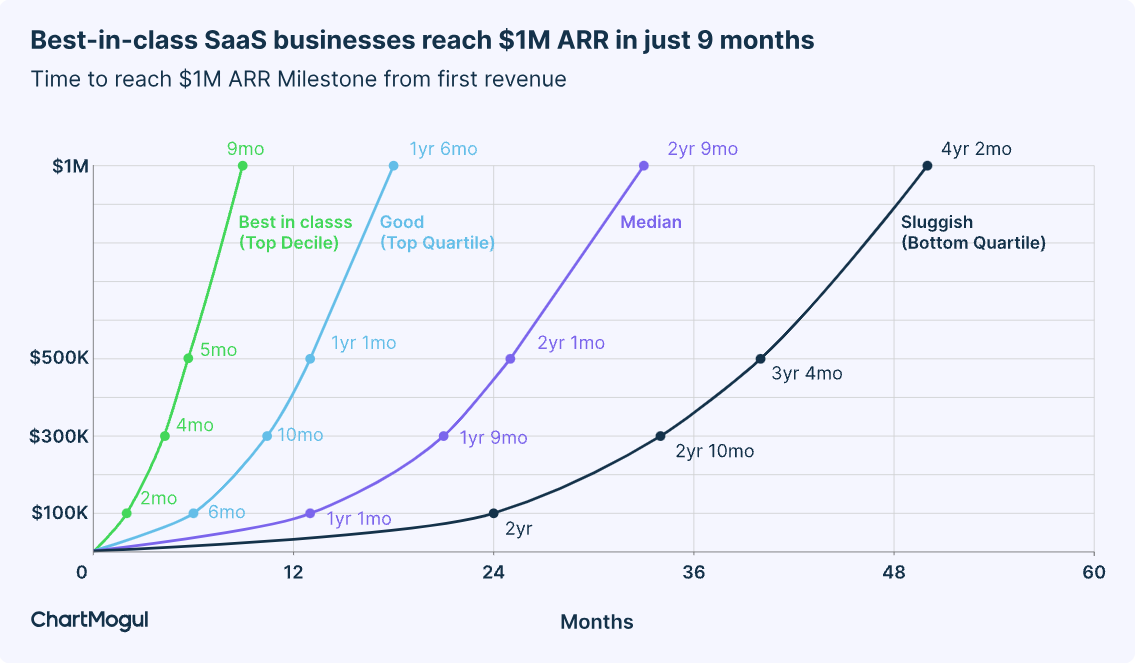
Time to $1M ARR
Best-in-class SaaS businesses reach the $1M ARR milestone in just 9 months (once they get their first paying customer). It takes the median startup around 2 years and 9 months.
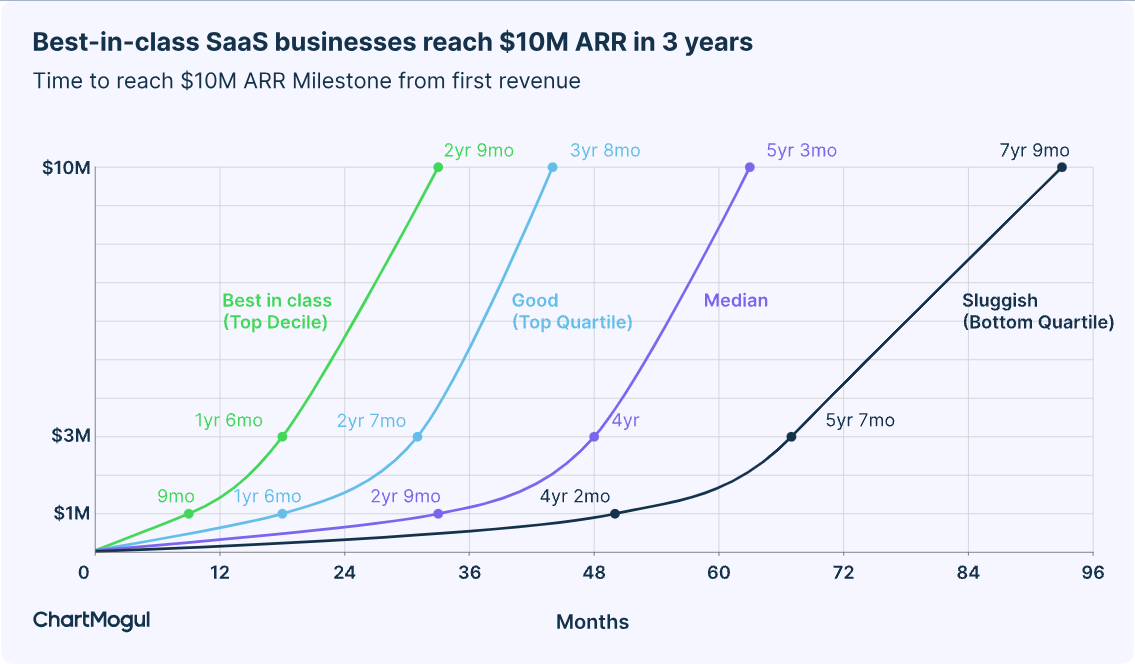
Time to $10M ARR
Best-in-class SaaS businesses reach the $10M ARR mark in 2 years and 9 months. It takes the median startup a little more than 5 years. The journey to $10M ARR is not often as linear. Sometimes the first few years are slow but then things accelerate once your startup hits product-market fit.
How to calculate SaaS growth rate
Calculation Methodology. We calculated compounded monthly growth rate (CMGR) using the following formula:
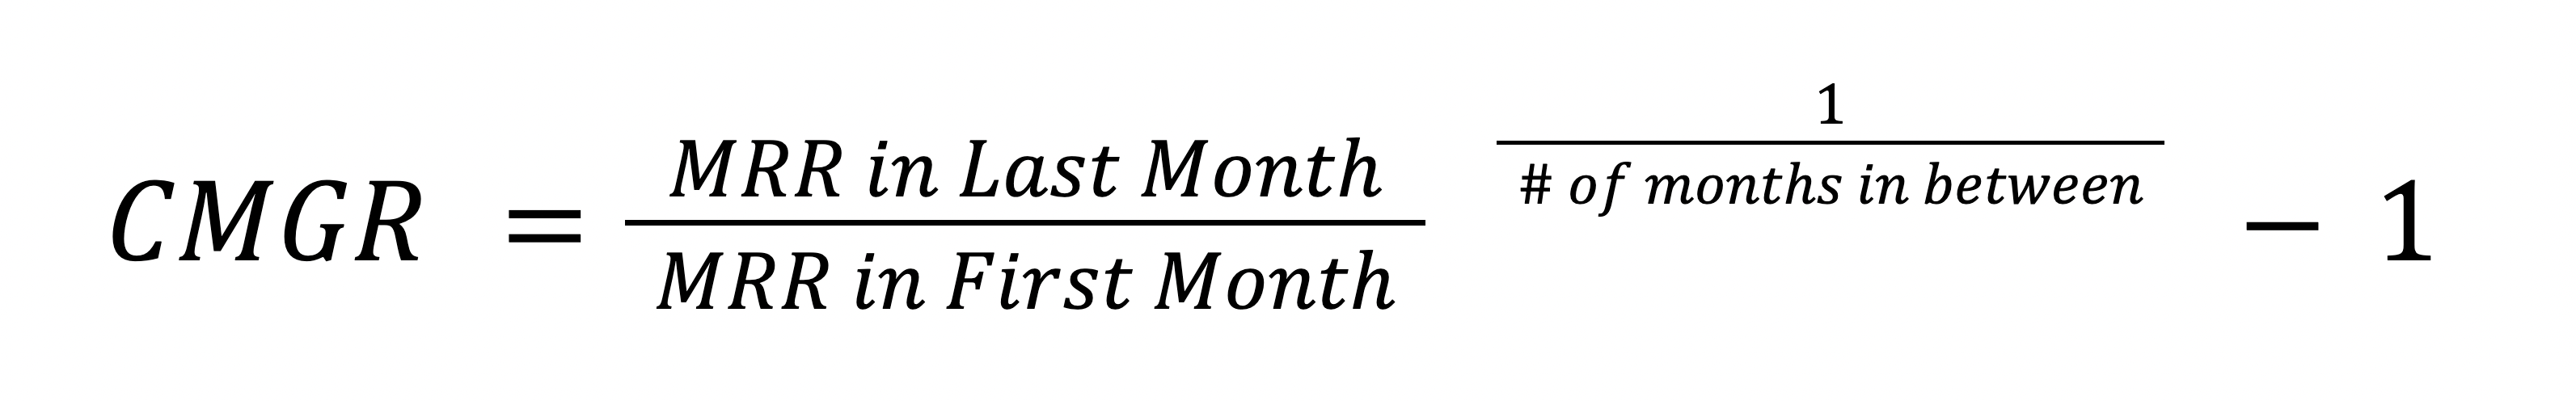
We limited the duration of the analysis to the past 12 months. In our opinion, if you analyze data older than 12 months, you start to encounter issues such as 1) the economic scenario changing or 2) the company jumping from one MRR band to another.
Here are some of the most common approaches that SaaS companies today use to measure their growth rate:
Revenue growth
MRR is a good starting point when you want to calculate your growth rate.
It allows you to observe your progress on a month-by-month basis, but also to compare how you’ve progressed over the last quarter or year by comparing your MRR in, say, November 2020 to the one in the same month of 2019.
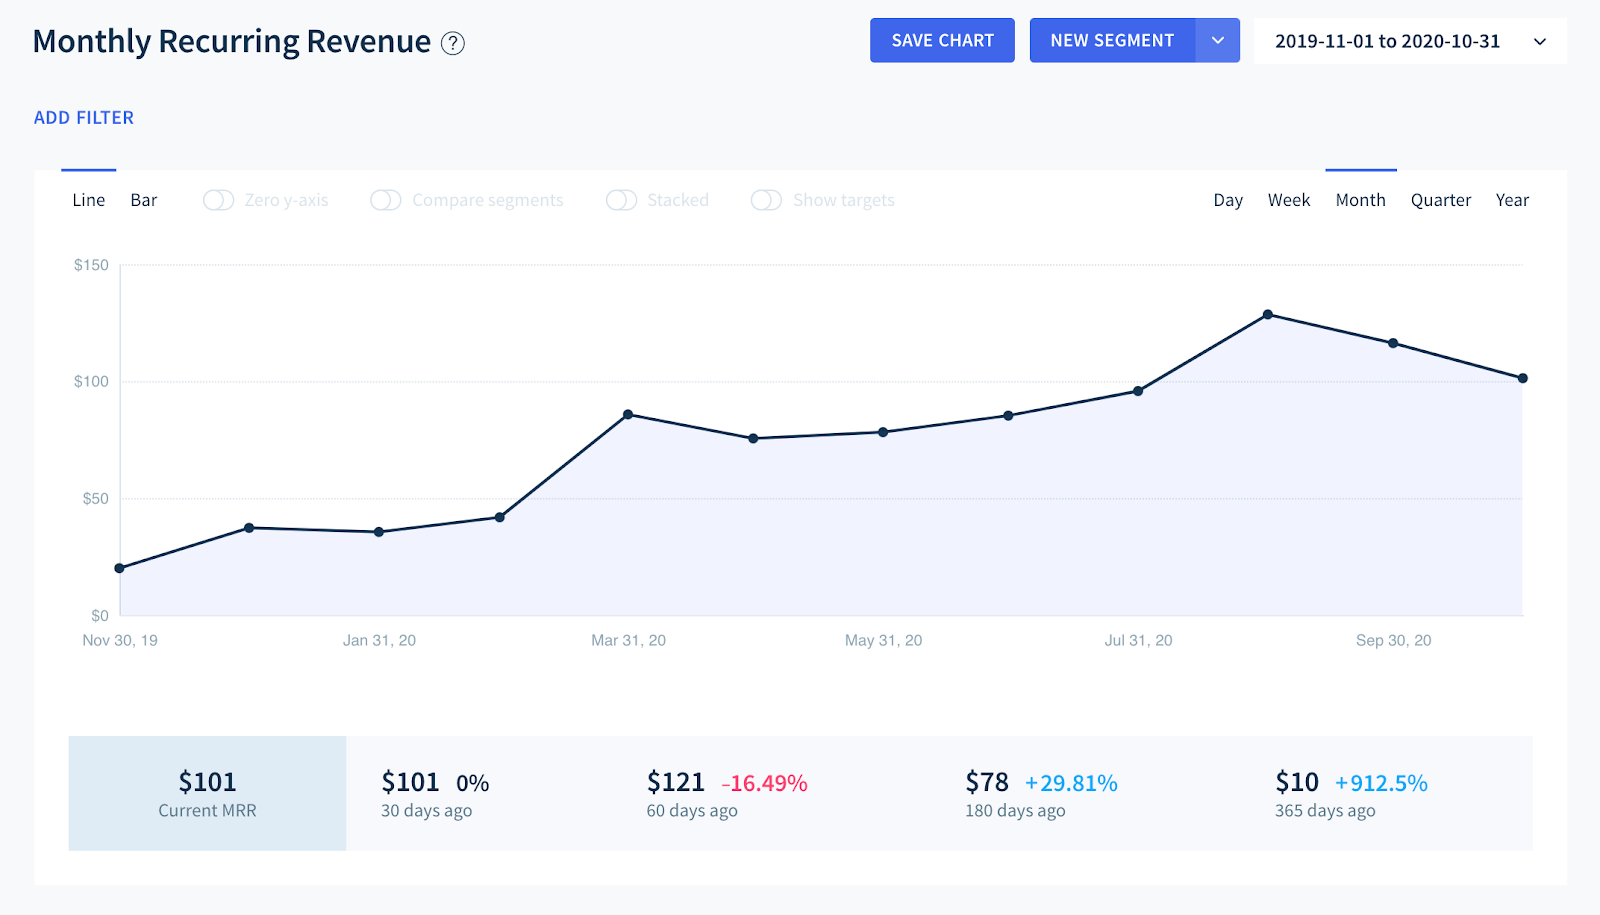
Our subscription data platform calculates this for you, but in case you need to do it yourself the formula is fairly simple:
MRR Growth rate = (End value of MRR – Start value of MRR) / Start value of MRR x 100
This calculation is useful as a top-level view or your growth or to check if things are going according to plan. For example, if you need to double revenue in a given year, you can use a CAGR calculator to find that you need to grow 5.95% each month to hit that goal.
By looking at your monthly growth rate you will know if you’re ahead or behind schedule.
Net Dollar Retention
Net Dollar Retention has emerged as one of the leading indicators of how well a SaaS company satisfies the needs of its existing user base.
The formula for it looks like this:
NDR = (Start value of MRR + Expansion & Upgrades – Contraction & Churn) / Start value of MRR) x 100
An NDR above 100% means you’re generating more revenue from your existing customer base — faster than you’re losing revenue from customers.
High NDR is indicative of a sticky product and is usually tied to a value metric. Companies like Slack and Zoom are famed for their high NDR which has fueled their exponential growth.
Natural Rate of Growth
In the last few years, Product-led growth (PLG) has emerged as one of the leading trends in growing startups.
A lot has been said about designing products for adoption and stickiness, using the freemium model and scalable pricing, to generate growth. However, OpenView, one of the leading voices on the topic, has made the case that we need a new way to measure growth in a PLG universe.
Sam Richard of OpenView argues this comes in the form of a new metric that they call Natural Rate of Growth (NRG).
NRG = Annual growth rate x % Organic signups x % ARR from PLG x 100
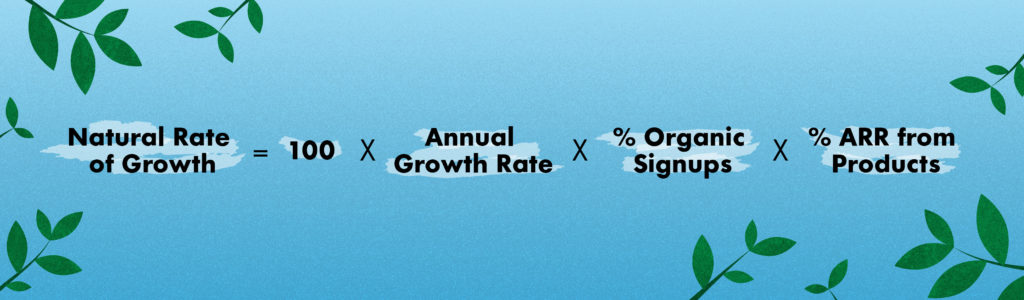
This one is a bit more complex, so I’ll try to unpack it here:
- Annual growth rate: This is just your MRR growth on an annual basis (i.e. your MRR this month, compared to the same month one year ago).
- Organic signups: OpenView has a good definition for this one: “Any signup you didn’t have to pay for”. Of course, in essence, you pay for every signup, but in this case, it means excluding customers who were acquired from paid ads, events, SDRs, and the like.
- ARR from product: For this, we’re looking at the incremental revenue that came from customers using the product. That excludes leads who went the sales-assisted path, requested a demo, etc.
NRG gives you a new way to measure and understand your growth, especially if you’re pursuing a PLG strategy.
In my experience, very few companies are entirely reliant on a PLG strategy, but I see an increasing number of teams get hooked on a hybrid strategy where there combine PLG with another motion.
In such cases, it is a lot more common to use several approaches towards measuring growth.
Factors that influence your growth rate
Many factors influence the growth rate of your SaaS startup, some of which are:
- Adoption — Does your target audience have that lightbulb moment where they realize the value of your product? Do they sign up for a trial to evaluate what you offer?
- Product usage and engagement — Is a user continuously engaged with the product? Or do they simply sign up and never revisit again? Engagement is a strong indication of eventual purchase.
- Conversion rates — How many of your leads convert to paying subscribers? Are leads still interested after their initial trial period?
- New leads source — Where are the new leads coming from? Are they only/primarily coming from paid marketing initiatives, or are they mostly coming from referrals/organic search? Organic leads are often more knowledgeable about the problem you are solving and/or have the highest intent, which indicates they are further ahead in their buying journey compared to leads who came via paid marketing.
- Reactivations — Do customers come back after they’ve churned ? This is a huge opportunity to win back customers who stopped using your product due to pricing, key features missing, or unsupported integrations.
- Expansion — Are your subscribers upgrading their subscription? If yes, what actions result in an expansion? If you charge per user per month and subscribers keep adding more users, that’s a super interesting trait. Or you might be offering additional products which your subscribers buy in addition to your main offering.
- Churn — The overall growth of the business depends on how much you lose each month. If you add 10 subscribers but lose 9, you really just grew by 1. Once you are clear why and how this happens, you can start digging deeper and increase your overall growth rate by reducing churn.
When looking at the various stages in the customer lifecycle, it’s important to understand all aspects of the funnel. Optimizing each stage will eventually lead to your desired growth rate.
Unlocking growth using segmentation
Growth is a key element on your road to success. Here’s why segmenting your data is important to unlock that growth, and gain further insights.
Why do SaaS businesses need segmentation?
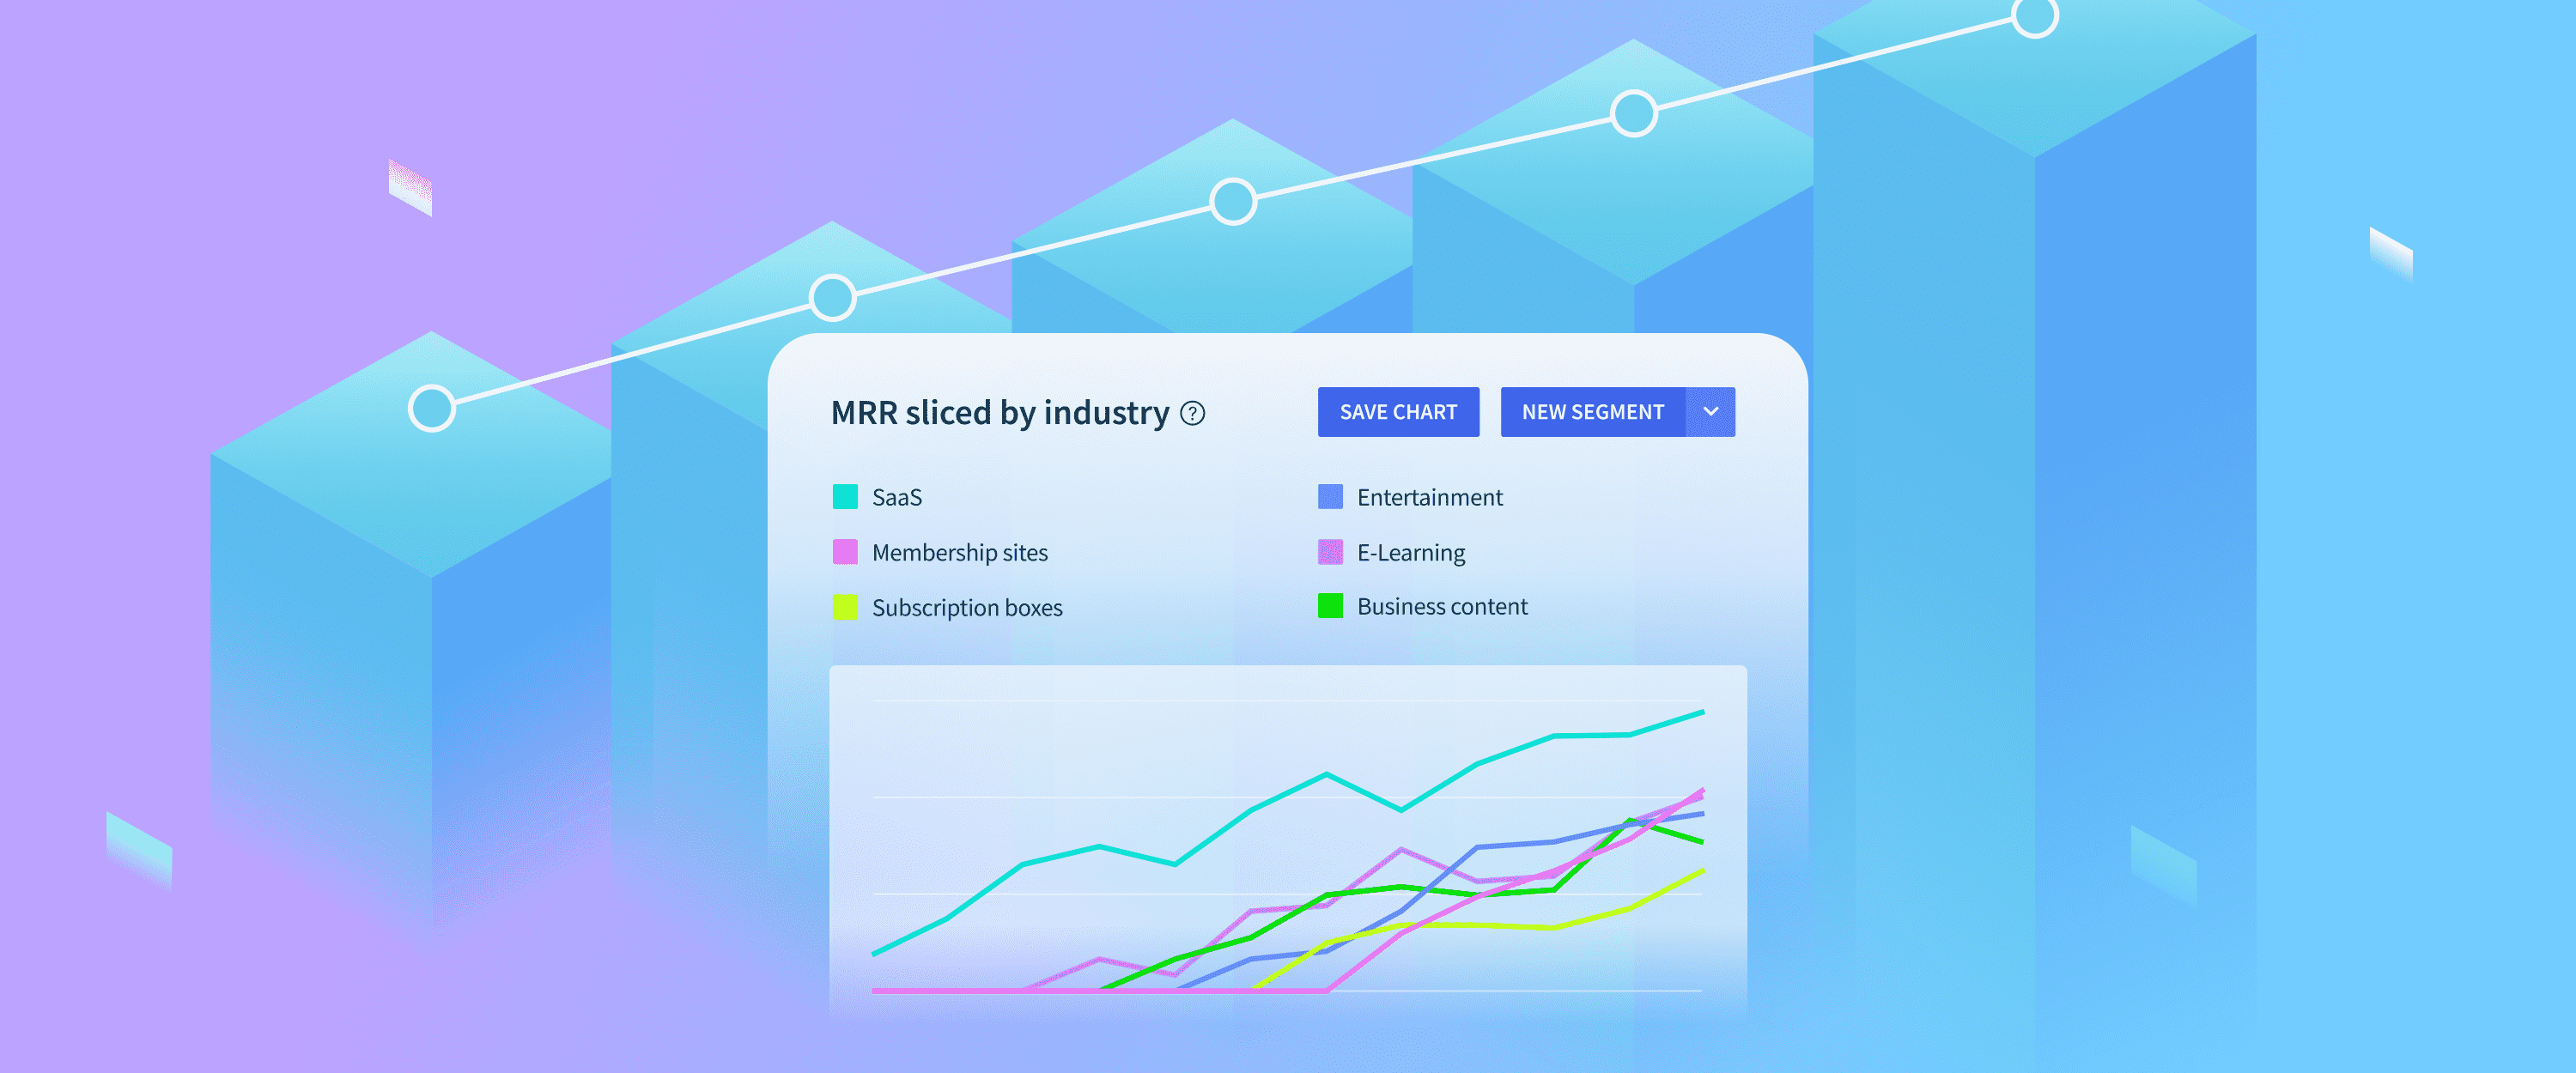
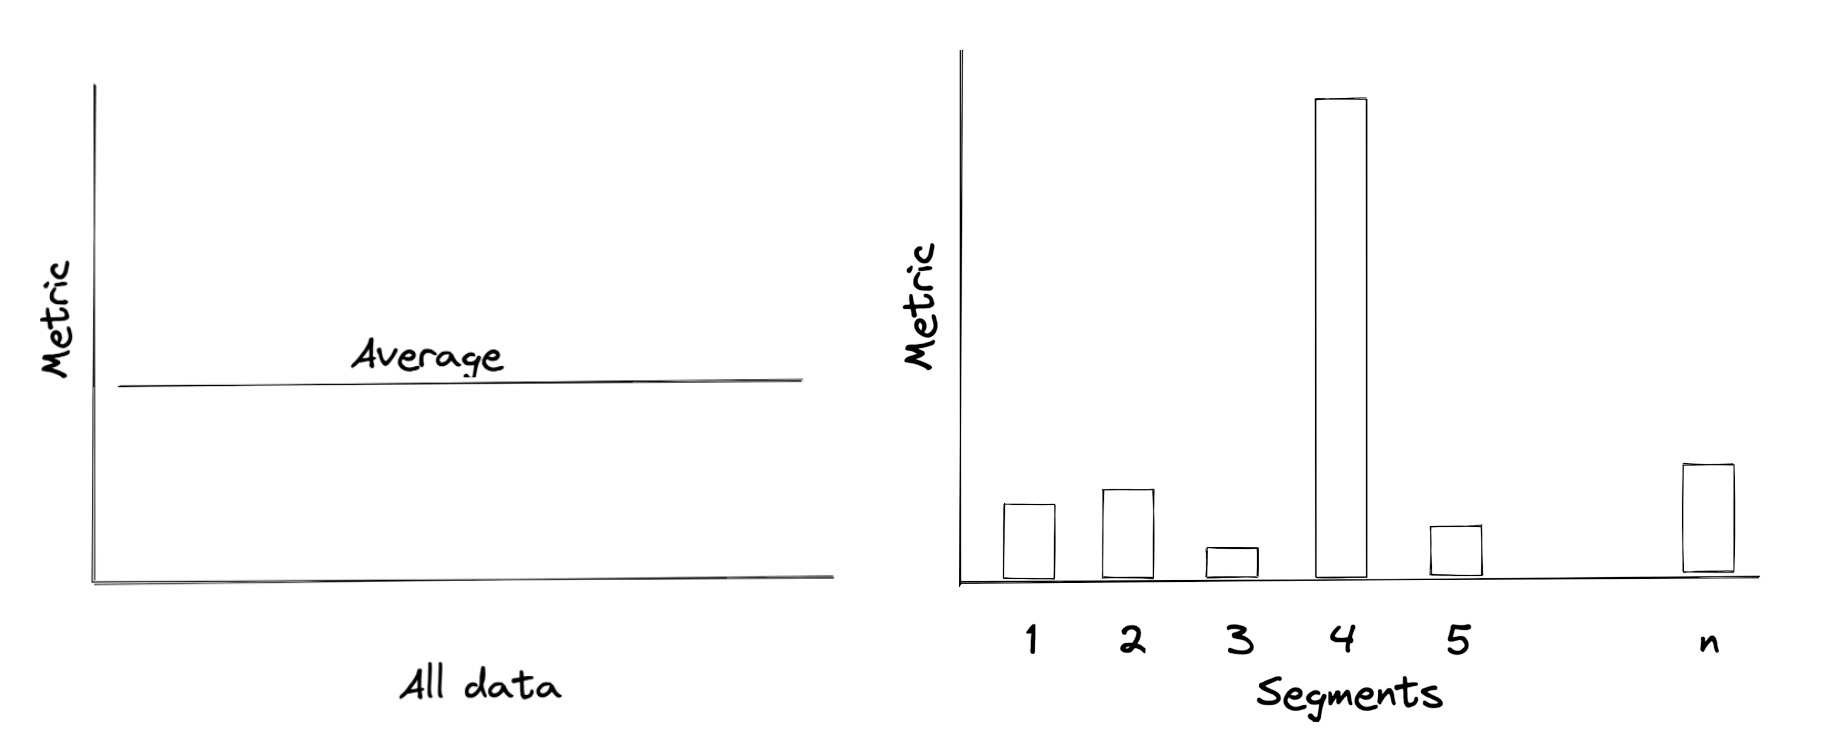
Overall metric averages are helpful to see directionality, but they often mask the underlying segment dynamics. For example, the chart on the left below, shows you a metric (say MRR) on average. Whereas the one on the right shows you the same metric split by segment of customers. Clearly, the second chart tells a more interesting story. It highlights that Segment 4 customers are the ones that you are getting the most MRR from, so you should double down on acquiring them (given they have the same acquisition cost)!
Segmentation is how HubSpot grew its business, as well. Brad Coffey, former Chief Strategy Officer at HubSpot shares their story.
At HubSpot, we started to see some of our biggest improvements in unit economics when we started segmenting our business and calculating the LTV to CAC ratio for each of our personas and go to market strategies.
As one good example – when we started this analysis, we had 12 reps selling directly into the VSB market and 4 reps selling through Value Added Resellers (VARs). When we looked at the math we realized we had a LTV:CAC ratio of 1.5 selling direct, and a LTV:CAC ratio of 5 selling through the channel. The solution was obvious. Twelve months later we had flipped our approach – keeping just 2 reps selling direct and 25 reps selling through the channel. This dramatically improved our overall economics in the segment and allowed us to continue growing.
Brad Coffey, former Chief Strategy Officer at HubSpot
Creating customer segments
Segmentation is an art on its own. It can be a challenge to create meaningful, actionable segments; however, there are some well-worn segments you can start looking at right away:
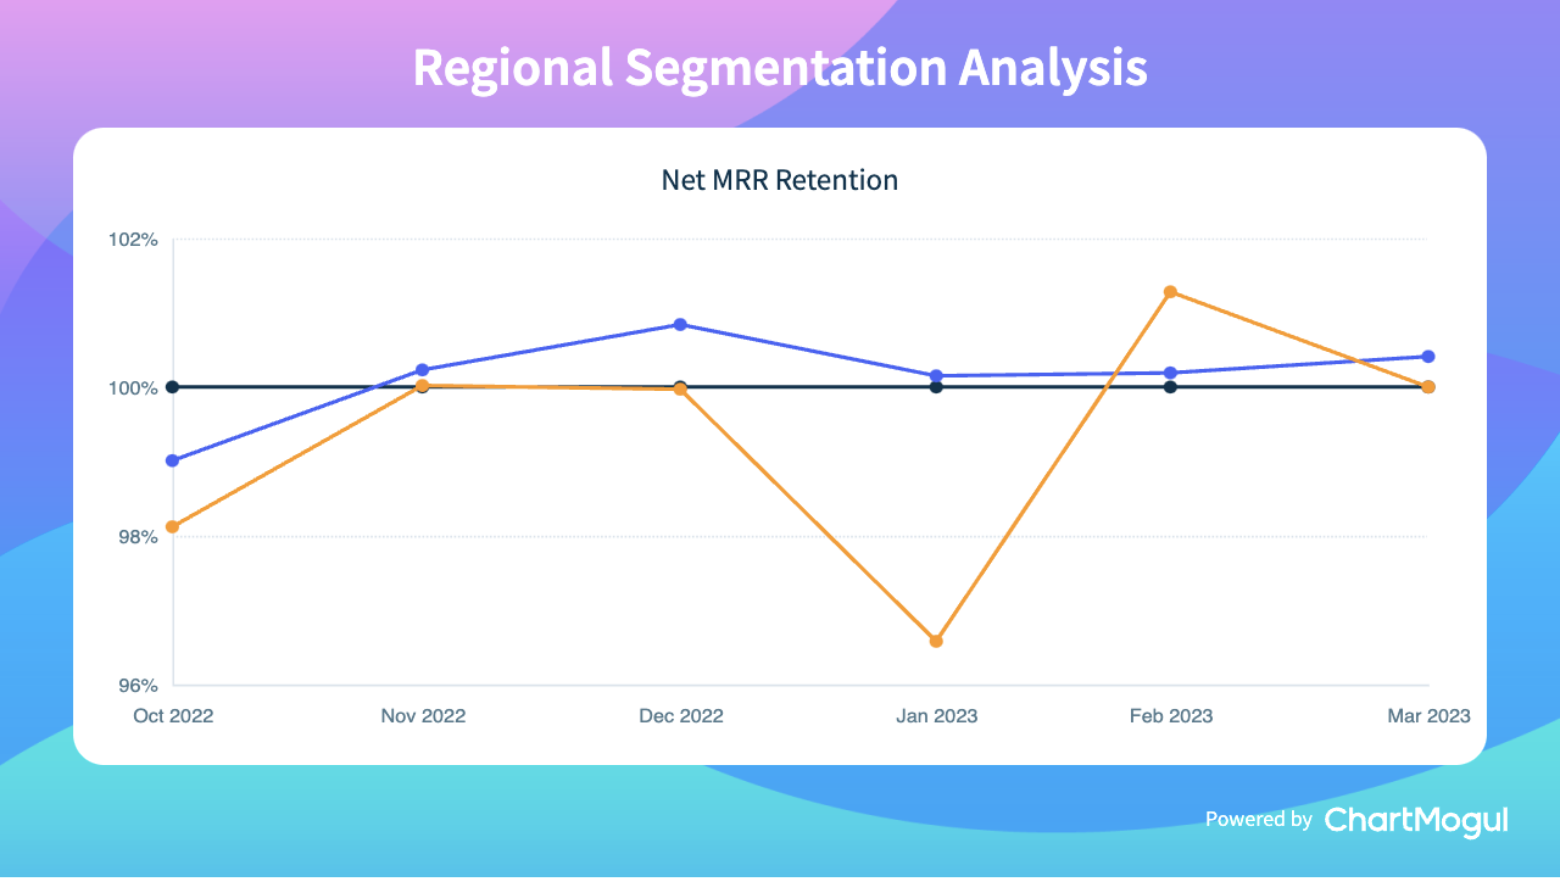
- By geography i.e. by country or region that shares unique characteristics
- By plan or product line
- By marketing/acquisition channel
- By usage metrics (last login, using a certain feature, etc)
- By company stats: size, industry, funding, etc
- By satisfaction metrics such as NPS score
Each of the above segments can be tested against their impact across each of the key SaaS metrics — conversion, MRR, Lifetime Value, Churn etc.
Segmentation is powerful, and can help you identify areas that you should focus on to unlock more growth. Learn more about getting started with segmentation in ChartMogul with this guide. Log in to your account or start your 14-day trial today.
Further Reading
- SaaS Growth Report
- SaaS Benchmarks Report
- What Is a Good Customer Churn Rate?
- What Is a Good Net MRR & Gross MRR Churn Rate?
- Understanding and Benchmarking Your MRR Movements