HappyFox founder Shalin Jain is obsessed with metrics and measurement. I paid the team a visit to understand how they’d moved from a hugely-complex spreadsheet for revenue analysis to ChartMogul.
The early, early days
When a SaaS founder talks about the “early days”, they usually refer to a time when they had to build their own marketing automation tool, or perhaps even run their own datacenter.
In the case of HappyFox Founder Shalin Jain, he refers to a time before SaaS even existed. You see, the HappyFox of today doesn’t look much like the HappyFox back then. In fact, it wasn’t even called HappyFox…
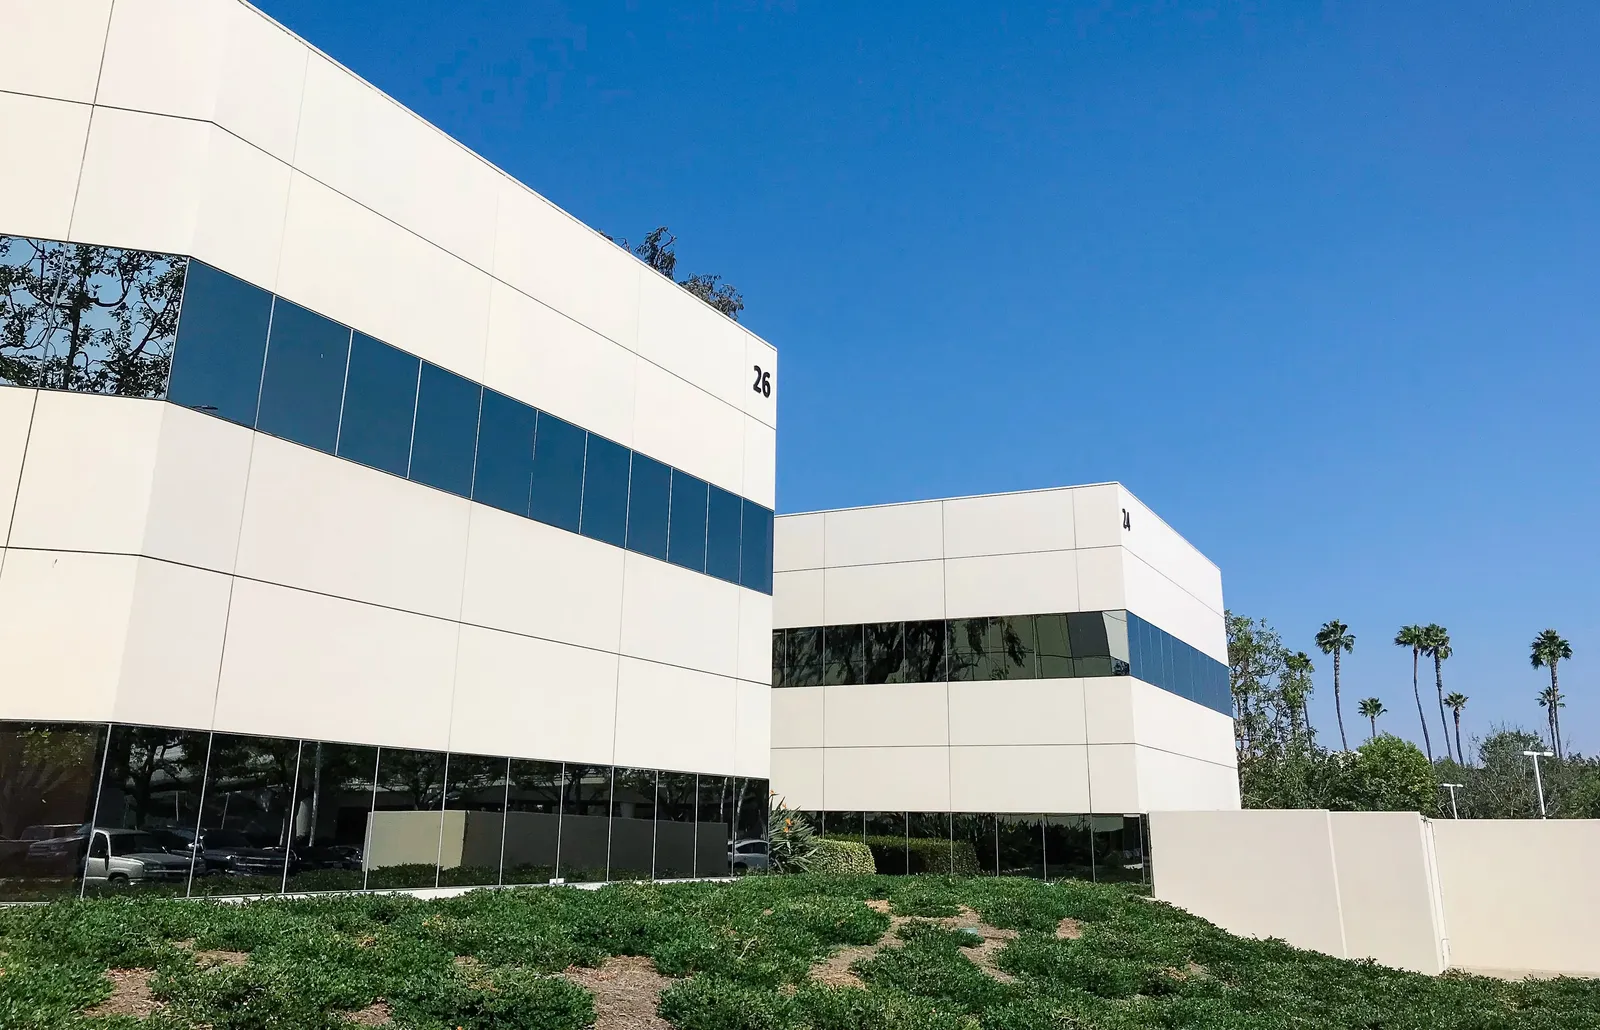
I stepped out of my hire car into a heatwave-stricken Irvine, California. I was here to pay a visit to the company’s US office to talk about the product’s origins and how they approach measuring their business. As soon as Shalin had told me about their former system of manually-maintained MRR spreadsheets (basically a full-time role), I knew there must be a story behind them transitioning to placing ChartMogul front and center of their revenue analytics.
"I come from a statistics background. I love looking at numbers, crunching numbers. I've seen and analyzed a lot of numbers so I know the value of that and how it drives me."
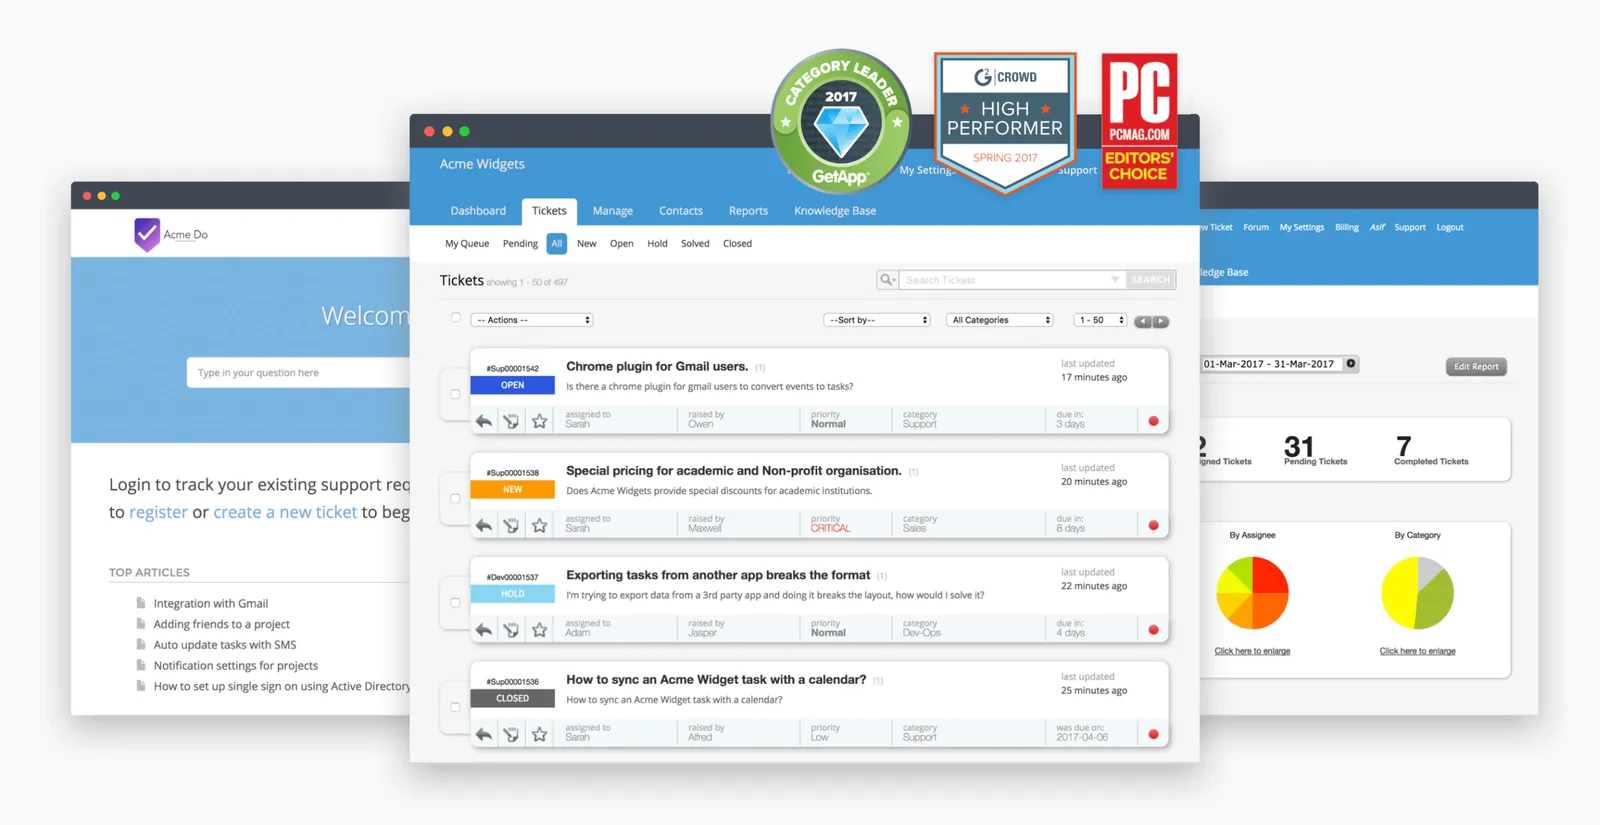
HappyFox is a help desk solution which exists in a crowded space. Yet, the team has been able to carve out a place for the product through customer-driven development, a careful onboarding process and strong customer expansion.
From humble (on-premise) origins
Shalin described how the original concept for HappyFox was born out of a [tooltip content="I'm sure I've heard that somewhere before..."]frustration with the tools available at the time[/tooltip]. His company was selling several software products, and was handling most support queries through email:
“I had been replying to customers' emails every day. I always enjoyed giving quick response times, because that would always make people buy - people always want to buy when the company is very responsive. They thought this company had a lot of people and that's why it was responding fast.”
Most solutions at the time either offered a clumsy experience or weren’t simple enough for the team’s needs…
“We had some free time, so one of the developers started writing a tool from scratch. We said let's do a UI and use this for ourselves... so we spent a couple of days and built the UI for what we called Helpdesk Pilot back then… We launched a simple AdWords campaign to find out if people wanted to buy a very basic email ticketing tool.”
And, (perhaps surprisingly) people wanted it. So they bought it!

Betting on the cloud
Helpdesk Pilot (as it was called back then) was completely on-premise, so customers had to purchase a license and run the software on their own infrastructure. This was notoriously difficult to build a smooth process around, because of the variables involved. Supporting software that’s running on completely unpredictable hardware in circumstances you don’t control isn’t much fun!
“Selling on-prem was hard, and pricing was extremely low... you have to deploy, maintain and provide support.” “A lot of people didn't renew, because it wasn't on recurring billing. So we had to chase for 20% and that was sometimes around $100. The Math just didn't come through.”
Eventually it became clear that the future was in cloud-based software, or SaaS. The gold rush to the cloud had begun, and it was time to re-invent Helpdesk Pilot.
“in 2010 we realised everyone was moving towards the cloud, and we don't want to do on-prem because it's very painful. Support is a huge pain, dealing with the problems of the client's environment.” “Our cloud model was born in 2010 -- we started writing the code -- and in 2011 we introduced HappyFox with a whole new branding.”
…and just like that, the SaaS-based HappyFox of today was born. Or at least, an early version of it...
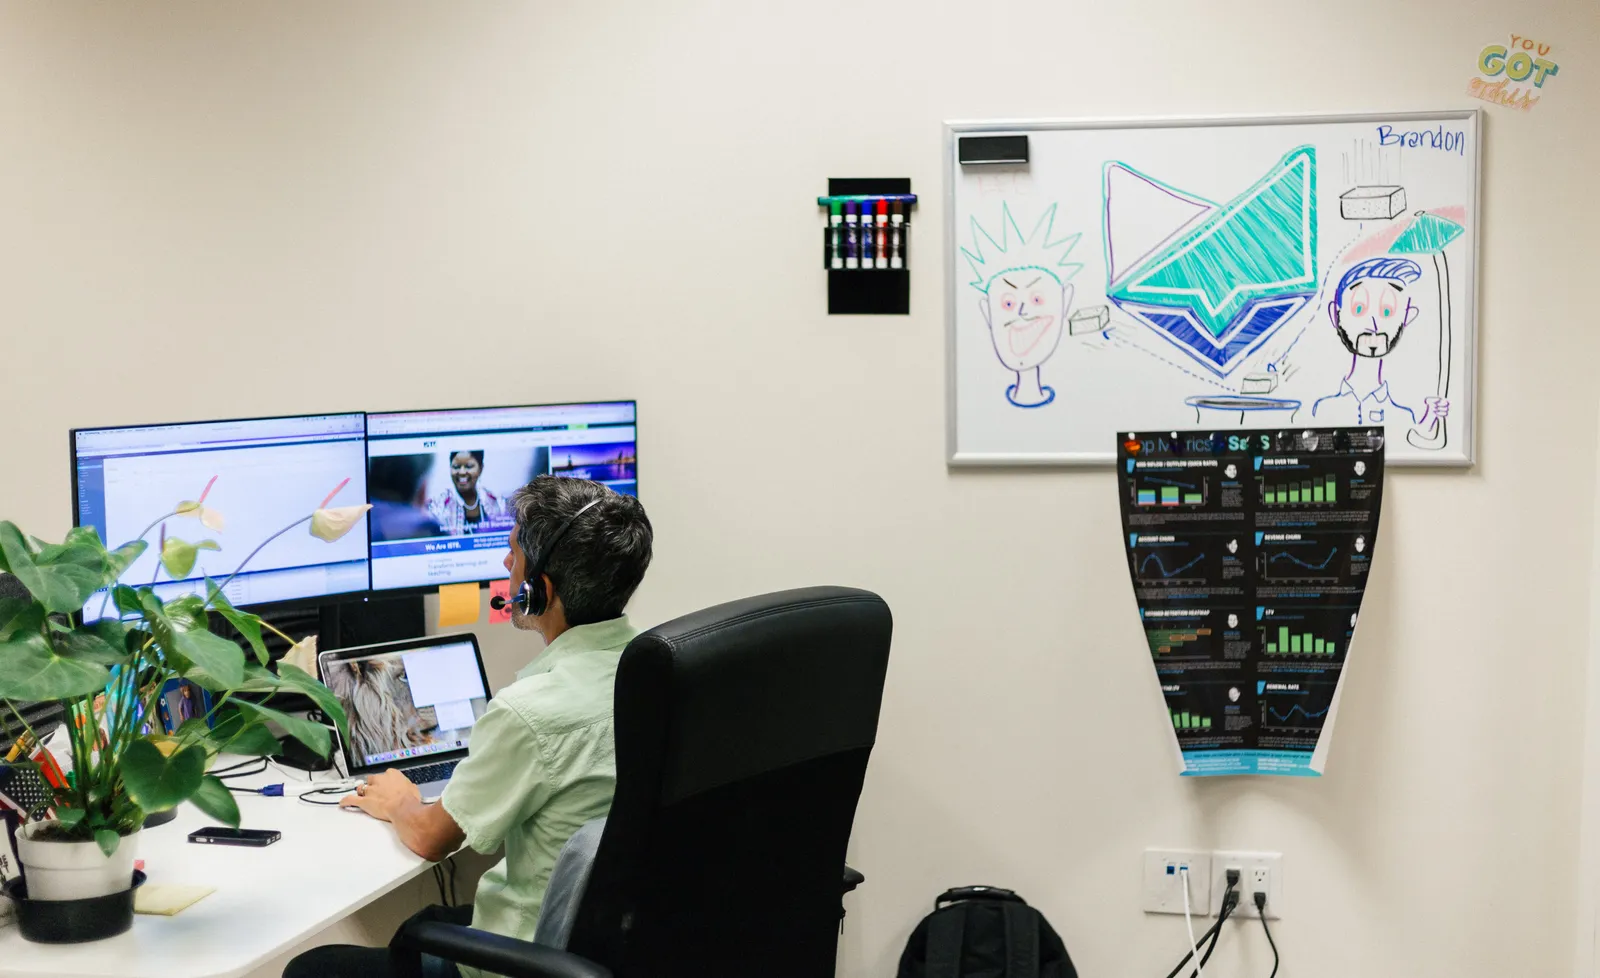
A healthy obsession with metrics
Quite early on in my time visiting the HappyFox team, it was clear that Shalin really runs a metrics-driven (or at least metrics-focused) business. Right from the very early days, all paying customers and recurring revenue transactions were tracked in a spreadsheet. This sheet evolved and grew over time — both in size and complexity.
“Back then we were using excel to input every single transaction we received… We were tracking MRR, LTV, ARPA. Every time there was an upgrade we were updating all of this. You won't believe that we did it... but it was always clear to us that the data was important.”
HappyFox was tracking many of the metrics that are considered critical to a SaaS business today, completely manually. This gave them a simple lean way to track the revenue data while they were small, but growing to thousands of customers and transactions meant that the manual maintenance process started to become unsustainable:
"It got to a point where it was impossible to maintain and became almost a full-time job for a person, but we never gave up... until we found ChartMogul.”
In fact, ChartMogul came in at a critical time for the HappyFox business, which was still in transition from the old on-premise model to the cloud. The two ran side-by-side for some time, and the team wanted to be sure that the new model could be financially-successful before phasing out the old product:
“We were moving from on-prem to cloud, and we had to prove that we could stop betting on the on-prem and start betting on the cloud.”
Introducing ChartMogul
Moving from such a complex manual system to a platform like ChartMogul required some investment too, from both sides. The team had designed their ideal set of metrics and ChartMogul at the time was under heavy feature development after launching out of private Beta and early support for Chargify, and there were some gaps to fill. However, both teams were determined to succeed:
"For a while we actually ran both… there was a lot of work to do together with ChartMogul, but if we cracked this then it would be a win for both CM and us.”
When the time came to make the switch, the rewards in terms of time saved were immediate and significant:
“We literally freed up 50% of someone's time in a week from not having to maintain that... it just wasn't scaling when you have hundreds of thousands of customers.”
New metrics led to fresh insights and decisions
The time-saving aspect was just one of many benefits to the company. What was arguably more valuable was the new array of analysis and metrics now available to Shalin and his team.
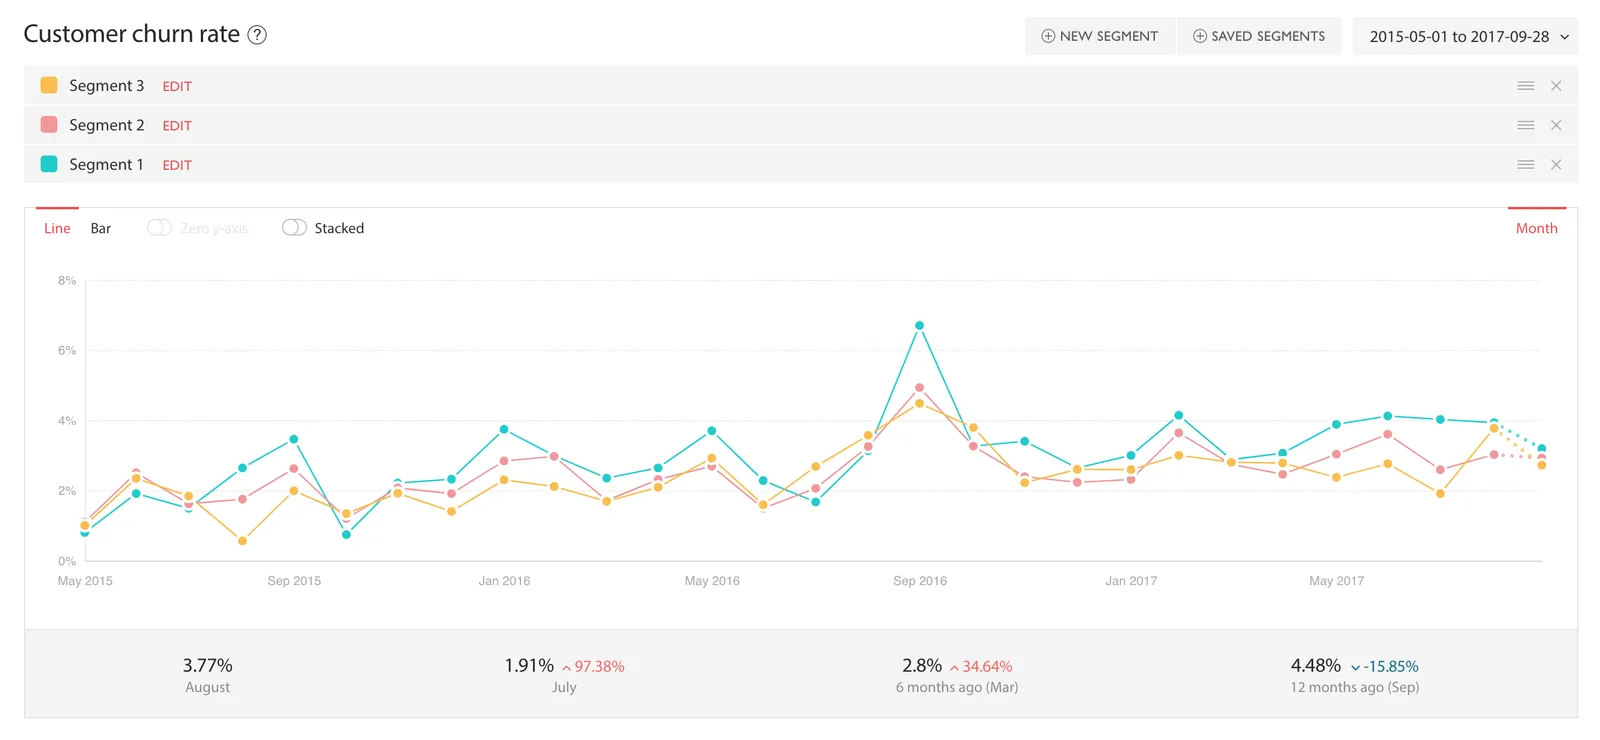
Case 1: Cutting churn by revising pricing
“When we implemented CM we had a lot of different metrics. We could say ‘I want to run a report on all the customers paying more than $300 - what is their churn rate?’”
Using the Segmentation tools to dig deeper into the data on churn rate, some new insights arose:
“…we actually realised that our highest churn is where someone has bought just one or two agents. We realised that one to two agents isn't really necessary when you need a helpdesk. You can survive with an email inbox. Sometimes if they didn't use the tool to its fullest capacity there's not so much value.” “We ran a churn report for customer <$300 MRR and that percentage was less than 0.5% margin. So that helped us make a pricing change. We decided we're going to support 3 agents minimum.“ “…anyone less than 3 agents probably doesn't need our software, and they might buy but they won't be a long-term customer. It not only added productivity to our sales team, it became very easy to cut down all that noise with churn.”
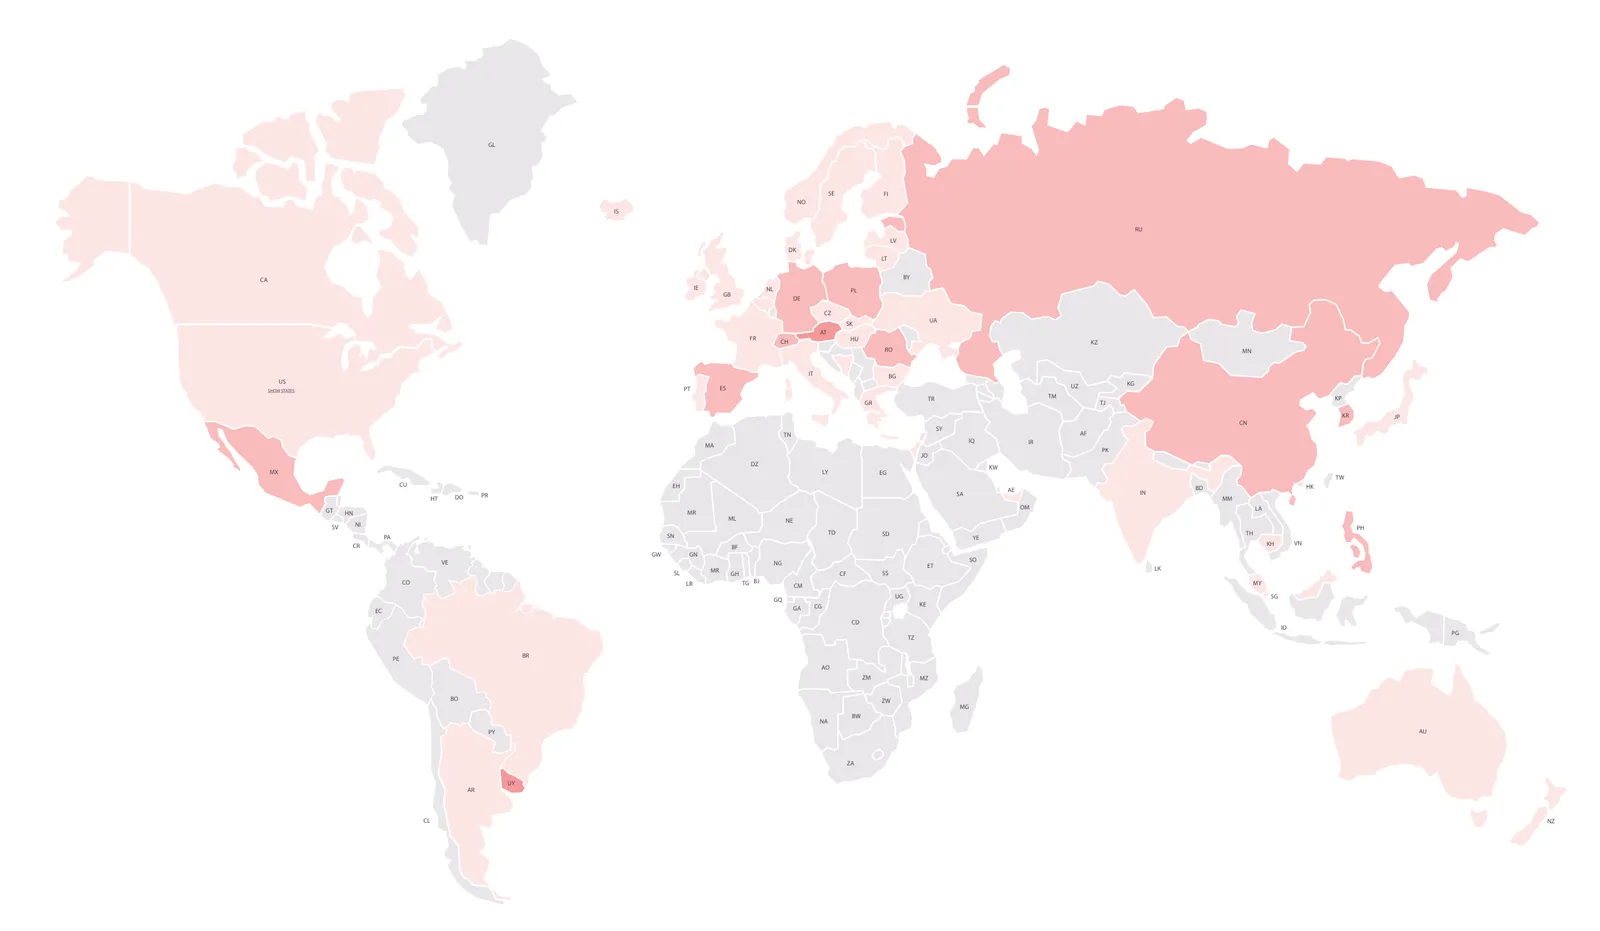
Case 2: Analyzing Average Sale Price (ASP) geographically
SaaS companies often don’t have enough data to know where to focus their paid Marketing efforts, so they end up running highly unfocused campaigns (i.e. globally) or just falling back to the U.S. Both cases are sub-optimal, and limit the vast opportunities from targeting specific regions.
For HappyFox, having access to Average Sale Price that could be filtered and segmented to individual geographical regions uncovered new areas to focus on:
“We were able to focus on the ASP. We were able to divide that ASP across different regions, with the Clearbit integration it made it a bit easier. We were able to make some decisions based on that. So I could say that in the US the ASP is higher, in India the ASP is lower and countries like AUS the ASP is higher than expected. So should I turn on Google Adwords for Australia or not? That helped me make this decision.”
Case 3: Revenue expansion-based sales compensation
HappyFox uses custom attributes and tagging in ChartMogul to add sales rep data to new customers. This way, they can build segments which show the revenue expansion for each sales rep in the company:
“We do our Sales commission on growth, based out of ChartMogul. So we look at expansions by the sales rep, by the month - they have a 6-month period within which an expansion happened, they get credit for it. We're doing that inside ChartMogul.”
Looking to the future
Shalin and his team have come a long way from their manual spreadsheet-based metrics, and we’re super-excited at ChartMogul to enable this level of automation and decision-making. And they’re far from done!
As the company’s growth continues, the data analysis aspect of their business becomes all the more critical. The team is continuing to dig into the data that can help them combat churn and further understand and optimize their revenue.
“We're very picky about this whole platform - our data and everything. We want to do as much as we can with automation. ChartMogul is basically a big enabler for us. It has saved us time, made it easy for us to make decisions, given us full visibility on the net MRR growth.” “To me, an advice for any SaaS entrepreneur is going to be “if you’re not using ChartMogul, you shouldn’t be running a SaaS business.” I mean, you can use all the other tools, but ChartMogul is the most sophisticated.”