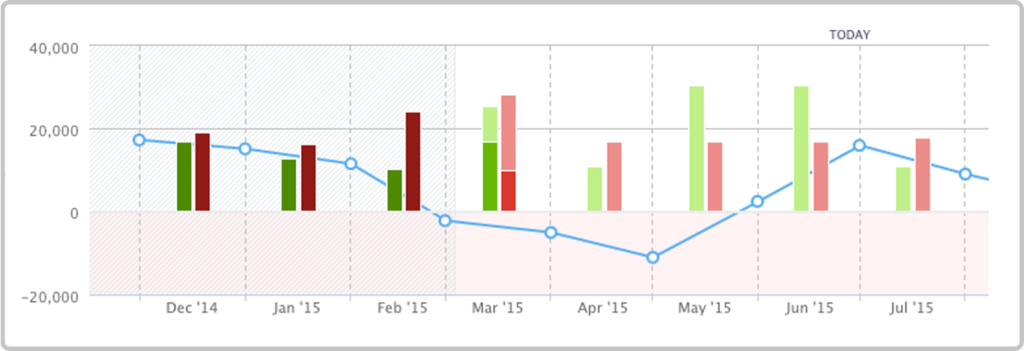
Float integrates with the most popular Accounting Software for Small Businesses:
- Float for Xero – integrates with Xero
- Float for FreeAgent – integrates with FreeAgent
- Float for QuickBooks – currently in beta, integrates with QuickBooks
Float is a product of The Float Yard Ltd, founded in October 2010 in Edinburgh, Scotland.
Float’s CEO and Co-founder of The Float Yard, Colin Hewitt, was running a digital agency. At the time, all their accounts were on a spreadsheet when he came up with the idea to develop Float. “After moving our accounting to the cloud – we were amazed at the efficiency of this, and said goodbye to our spreadsheet – the only problem being the lack of forward looking cash flow. So we decided to build Float. Float shows you your future bank balance by pulling data from both your accounting software and your CRM system to provide a real-time cash view of the business. It’s aimed at business owners, as a tool they can actually understand and use!”
Payment products and manual work weren’t good enough for tracking MRR
Prior to the integration of ChartMogul, recurring revenue analytics were done directly with Stripe. However, as Colin puts it:
“[Stripe] didn’t track active customer numbers, or churn rate or anything else. We actually used Evernote and updated it manually – it was pretty inaccurate!”.
It was so inaccurate and labor intensive, in fact, that churn, LTV and other SaaS metrics were not even calculated. It was clear that they needed something more accurate and automated – and in their search they found ChartMogul.
ChartMogul removes the pain from calculating and understanding a company’s recurring revenue. It does this by providing – through 1-click integrations into the subscription billing platforms like Stripe – beautifully simple subscription analytics with little to no configuration.
“The transition [to ChartMogul] was really easy, we just connected Stripe and there it was!”.
It provides exactly the kind of analytics Float was looking for: Monthly Recurring Revenue (MRR), Churn Rate, Customer Churn Rate, Customer Lifetime Value – and all with multi-currency and geo-mapping. In particular, Colin points out that “Churn Rate is something we track pretty closely and being able to look back over a year and see that metric improving is a great indicator that things are moving in the right direction. For monthly board reporting – we basically copy and paste the key growth graphs, saves a lot of time”.
ChartMogul has made a huge difference for Float
As Colin explains. “It’s been great to be able to pass on accurate info whenever we’re asked – every investor wants to see the metrics and to be able to show we’re on it – feels great. The whole management team is able to track key metrics now at any time they need them.”

Colin adds that “having those key metrics to hand is something that you always want to be able to see, and actually learning about some of your other metrics you might not be as familiar with like LTV or ARPA is great for any founder to be up to understand”.
Unparalleled insights
ChartMogul adds an extra sophisticated layer of intelligence by offering Cohort Analysis: Observing what happens to a group of customers that joined in a particular time period. It allows companies to better understand the changes in subscription life cycles, helping the decision making process so the company can take action in time to upgrade or avoid a revenue loss.