
What metrics do you use? How do you measure the success of what you publish? In my opinion, these two questions are what keeps most content people awake at night.
When presenting our content strategy at ChartMogul — which definitely doesn’t conform to many of the “norms” in the industry — the immediate question is always the same: How do you know whether you’re succeeding at this? What metrics do you measure?
It’s probably a little overdue then, that we share our approach to measuring content at ChartMogul. Just one disclaimer though: This is not a one-size-fits-all approach. It’s a set of values that define the way we operate, and for us it works well. I’m not preaching here — just sharing our approach since so many of you have asked ;)
Why do we measure?
A modern Marketing team in 2017 is overwhelmed with data. We’ve written about this recently, as well as the need for better data literacy to empower people to make sense (and use) of such datasets.
In 2017, we measure because it’s easy, and almost every tool and system we use leaves a trail of data behind for you to analyze and scratch your chin over. Data storage is cheaper than ever, cloud connectivity means that everything can constantly “phone home”, so why not? Data is the currency of the future, so we should be aggressively hoarding it. The data FOMO is real.
Although Content Marketing is a term that only really exists in the era of the web, we’ve been marketing our products with “content” for decades. We just weren’t able to measure it very effectively. That full page spread you ran in the New York Times? Who knows how many people were affected by it, or even saw it. Or how many new customers it brought you. Because of this, such campaigns were treated more as exercises in branding — with the goal of drumming up increased brand awareness rather than new customers.
When Marketing moved online from print, TV and other forms of media, it was a breath of fresh air for industry veterans who were used to basically zero capability to measure the success of campaigns.
Today, the Content Marketing involves a huge array of metrics, many of which originate from a display advertising background, in an attempt to quantify the success of their efforts. Which articles bring the most new customers? Measure it. Which webinars bring the most-engaged leads? Just measure it! You get the idea.
It’s not so often that we sit back and question this strategy on a higher level, especially with so many influencers adopting a "copy this growth hack today!" attitude. Does it really make sense for content marketing to try and imitate the display advertising industry when their goals are so fundamentally different?
What’s driving the need to think differently
The problem is, the metrics we use so often in Content Marketing on the web today aren’t well-aligned with our true goals for what we’re trying to achieve with the efforts in the first place. And in some cases we’ve trodden so far away from the path that it’s hard to go back.
As Intercom’s Managing Editor John Collins puts it:
“It’s all 'get-rich-quick' schemes about the marketing and promotion, and there’s very, very little about the content itself.”
It’s so tempting to chase the vanity metrics and short-term gains that come with traffic spikes and clicks. But with any “quick win” strategy, there’s little benefit to be had in the long term.
A friend recently told me a great analogy about Content Marketing efforts within a business. He described Content Marketing as a big wheel that you’re trying to build and put in motion.

The key point to make here is that it takes a TON of energy to get this wheel moving; months or even years of effort, without much in the way of a return on your investment. But once you get the wheel moving and things really start to pick up speed, the momentum of the thing is massive. The power of the whole operation becomes almost unstoppable. This is Content Marketing — the long game. It can take years to see the fruits of your hard labor.
Super quick story:
One week in 2016 I checked the analytics for ChartMogul's blog -- how many people were reading, what the most popular articles were for that particular week.
I nearly dropped my coffee when I saw that THREE of the top five articles for that week were OVER A YEAR old. I mean, I knew evergreen content is... well, evergreen... but wow!
THIS is the big wheel in action.
However, chasing short term wins and “get-rich-quick” schemes doesn't contribute towards that overall momentum. They result in you building a wheel that’s much, much easier to accelerate, but as soon as you stop pushing, the thing stops. Something like this:

So for us at ChartMogul, if we’re going to measure what we’re doing at all, we want to measure the ongoing acceleration of this big wheel we’ve built. Because that’s our goal.
Enough wheel analogies. What are your actual goals?
I’m so glad you asked! We want to:
- Establish and build our brand as a respected thought leader in our space
- Educate the market on SaaS metrics, data and analytics
- Build a highly-engaged, recurring audience and community
- Drive awareness of our product and its value
- Support our product goals by helping our customers build a better subscription business
The two metrics that don't work
Web traffic: A relic from the display advertising boom
Measuring traffic to your website is great if your business model is directly linked to the amount of traffic you get to your website, i.e. advertising.
The mistake that many people make is to extend this to include “winning new signups for your product”, and the reality is that it just doesn’t work that way. The traffic metric doesn’t care about who is visiting, why and how they got there, or how engaged they are with your brand.
Trial signups: A lagging indicator of success
Content for us today is more of a branding exercise than anything else. That is to say, our main goal is to build and grow our brand, gain recognition in the market and create positive brand association for our audience. This is definitely connected to eventual new signups for our product — but that’s too much of a lag indicator to be of any use. Engagement is far closer to our goals, and far more useful for making decisions about what we do more (and less) of.
What we measure at ChartMogul
The one word I’d use to describe what we’re trying to measure for our content is engagement. If we can tell when we’re producing work that people are highly engaged with, for us that’s a sign of success.
Engagement blows past the misleading page-view-oriented metrics, resulting in quantitative, meaningful metrics that are rarely skewed.
These are some of the metrics we use as a measure of engagement, and to guide our strategic decisions for the future.
- Article share rate
- Article “share referral” rate — how many inbound referrals are generated from a single share? This goes some way towards measuring virality.
- Article completion rate (how much are people reading?)
- Monthly active audience — how many engaged people are we reaching on a monthly basis?
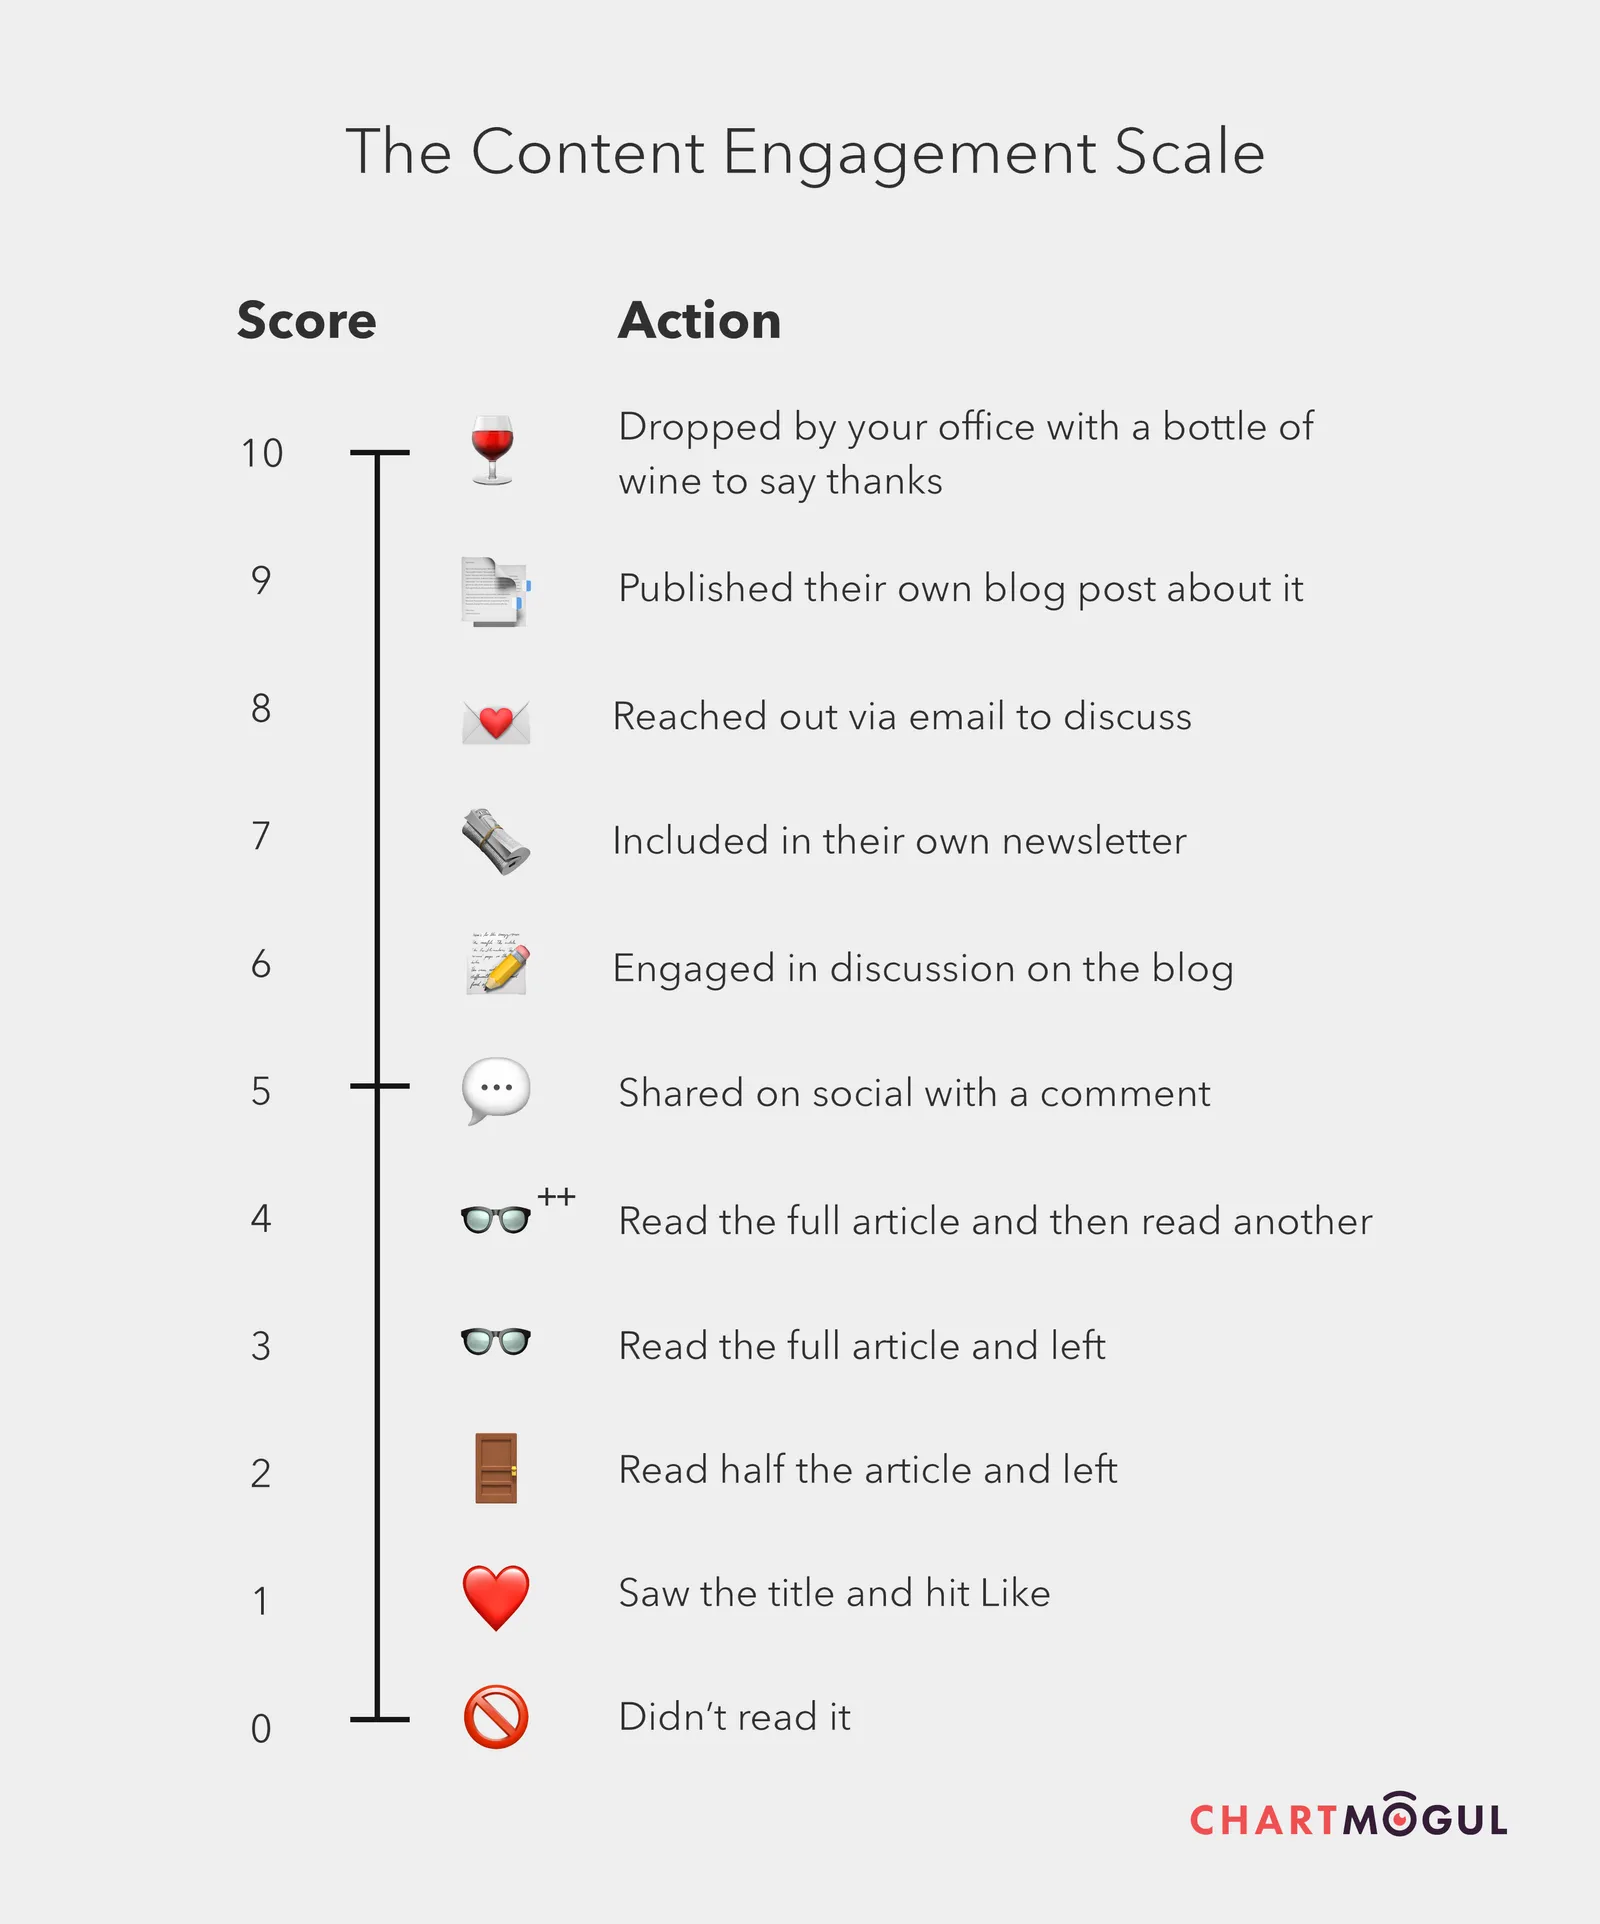
Not all engagement is equal
…and that’s awesome! There are many ways in which users can engage with your content, each of which can be used as a flag for just how engaged people are. This usually corresponds to the amount of effort required for the engagement, e.g. clicking a Like button is fairly low effort, but commenting on our blog is much higher.
This is generally how we classify engagement at ChartMogul:
Implementing engagement metrics
There are many different ways in which you can start focusing your content organisation on engagement as a compass. Tools like GetSocial will measure metrics like referral rate and share rate on a per-article basis, giving you a really strong indicator of the kind of content that resonates with your audience. They also measure “dark social” — the shares that usually happen invisibly, through URL copy-paste rather than share buttons. When we implemented GetSocial we found that over 90%(!) of our shares fell into this category — if you’re not measuring it, you may be making decisions based on a tiny slice of your data.
The team at Medium focus on Total Time Reading (TTR) as their engagement metric.
When it comes to measuring social interaction, we use SmarterQueue which is focused around an evergreen content strategy (the only viable B2B content strategy in 2017). SmarterQueue gives us some nice stats on our share rate, or interaction rate per post — another way to measure engagement.
Even Google Analytics has some engagement metrics out of the box. Bounce rate, session duration and even creating your own custom goals can help you discover how engaged your audience is.
Final word
For a company building an analytics business, it might surprise you that our Content team is fairly light on metrics. That's because we actively reject those that don't offer any usefulness, or allow us to make decisions about our work. Non-actionable metrics are a distraction from the real goal, and we could all do with a little less distraction in the industry today.