Having access to reliable data in real time within ChartMogul helps Meditopia find the sweet spot between growing sustainably and reaching as many people as possible.
What is Meditopia
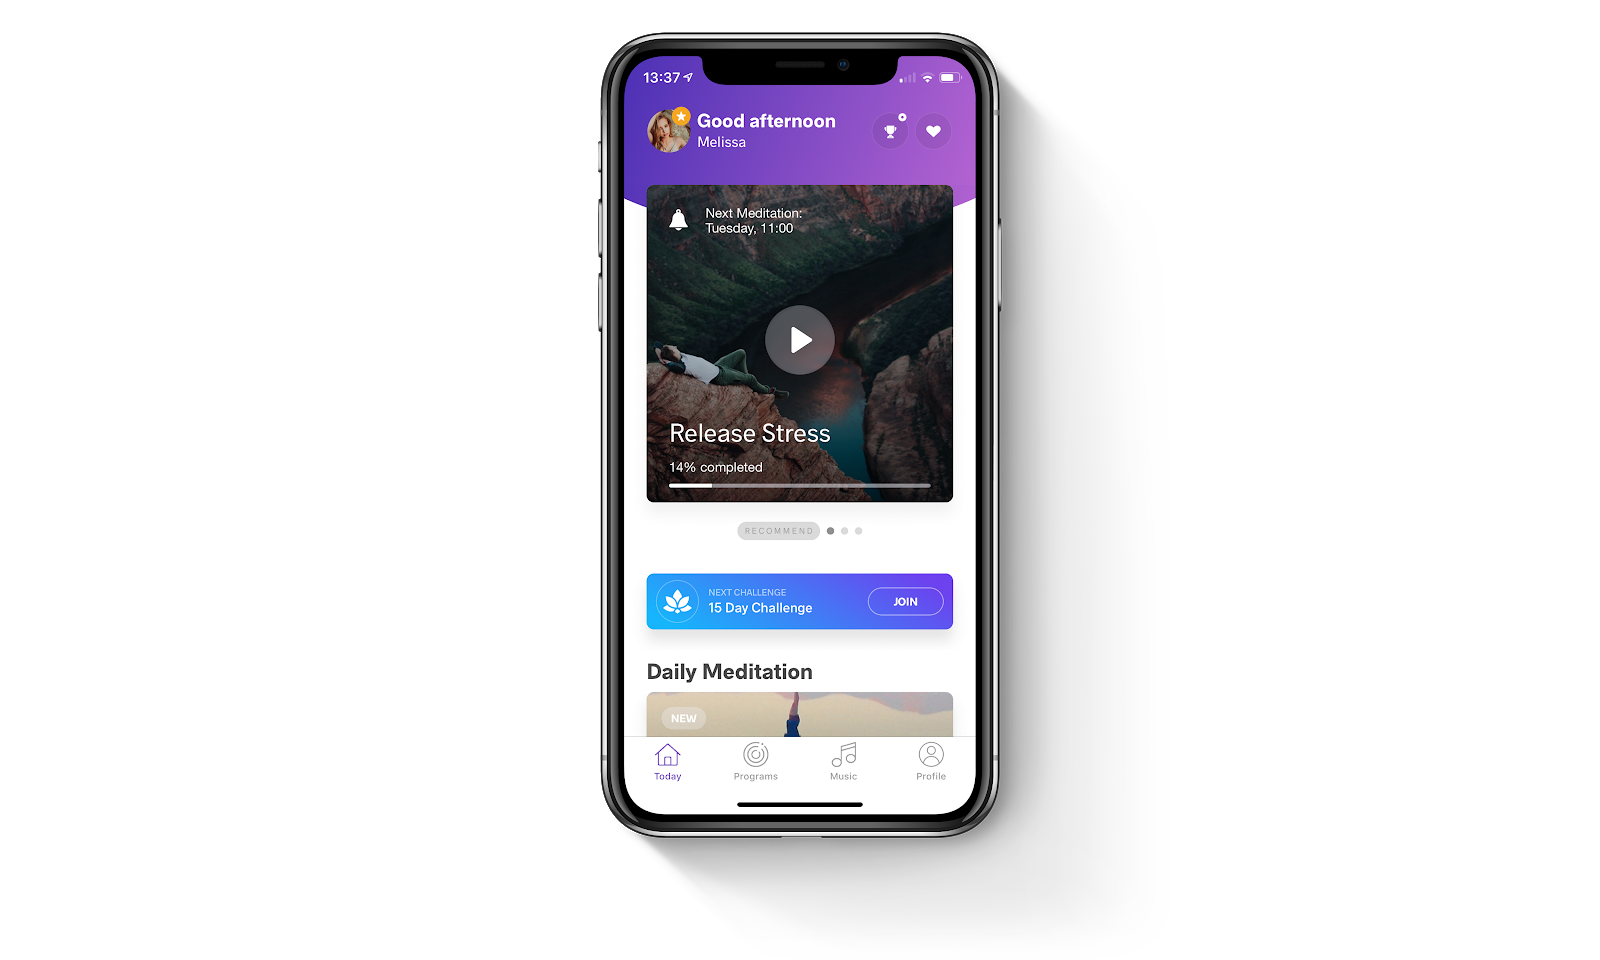
Meditopia is a mental wellness platform that provides personalized content — mindfulness-based meditations, sleep meditations, and more — to help people build mental resilience in their daily lives.
In a world with a high level of stress and external stimulants, Meditopia wants to reach as many people as possible and to help them mend the connection between their bodies and their minds. The platform offers over 400 recorded sessions on a broad range of topics: stress, anxiety, pregnancy, sexuality, etc.
After answering a few questions, you can start your mindfulness practice with 5 to 20-minute sessions which are prepared by top professionals in their fields.
You can find content for every occasion you are in: if you are in the office, preparing for an important meeting, having a walk in the park or preparing for tomorrow’s exam. Meditopia offers high-quality audio content to help you connect with yourself.

Meditopia’s team of 20+ employees is split between offices in Berlin and Istanbul and several remote freelancers who are responsible for translating and localizing the platform.
The team is united around a single mission that goes beyond revenue: they want to reach and support as many people worldwide as possible. However, to do that, they also need to find a business model that allows them to achieve that in a sustainable way. ChartMogul has been instrumental in helping them achieve that fine balance.
We spoke to Berk Yilmaz, the CEO of Meditopia, to learn about how he and the rest of the Meditopia team use ChartMogul to grow sustainably and continue to provide the service to their customers.
The Challenge: Tracking and analyzing user data is a big job
Meditopia operates as a web and mobile platform, with apps for iOS and Android devices. It is also a highly diversified business. They have over 4.5 million users worldwide, the content is available in 6 different languages (English, German, Spanish, French, Portuguese, Russian, and Turkish) and they’re growing quickly.
As a subscription business, it is important for the team to do analytics and to understand the number and behavior of their customers.
Meditopia relies on a freemium model where they first acquire users for the app and then look to turn them into paid customers. Because of that, the team has to be sure they’re putting their resources into targeting the people who are the best fit for the app. They achieve that by looking at their metrics.
Measuring churn, looking at conversion rates by country, and doing cohort analysis are all complicated and time-consuming, so doing analytics properly is a big job for Meditopia!
Before they started using ChartMogul, Berk was thinking about hiring a full-time analyst to collect all this data and help them make sense of it.
Multi-platform adds another challenge

In the beginning, Berk and his team were using the native analytics of the platforms where they offered their app — the Apple App Store and Google Play.
However, as they expanded with the addition of a web platform, they understood they needed a comprehensive solution that would allow them to integrate their data from all the sources they were using, and to perform more complicated analyses.
In addition, the native analytics of the platforms did not allow them to get some of the insight Berk and his team needed — such as retention analysis.
Data security was the final consideration
Berk shared with us that the security of the data they added in their analytics platform was a deciding factor when they were looking at alternatives.
Some platforms provide analytics for free, but there’s always the risk that they use your data in some way that you wouldn’t be happy with. We needed something that would guarantee the security of our data and help us make sense of our subscribers.
Berk Yilmaz, CEO
Initially, the team briefly considered building an analytics tool internally, but they quickly dismissed the idea because it would have required them to dedicate too many resources. That’s when they decided to look for a product that would fit their needs.
Berk splits his time between Istanbul and Berlin where the two main offices of Meditopia are. He met ChartMogul CEO Nick Franklin at a meetup in Berlin. As Nick was telling him about ChartMogul, Berk realized it sounded exactly like the analytics platform they were looking for.
The Solution: ChartMogul provided new insights into Meditopia’s business
Berk shared that integrating with ChartMogul was quick and easy — thanks to the native integrations, the API, and the Developer Hub, they found it easy to bring their data into the platform.
The ChartMogul success team provided integration guidelines and helped them get their data from Google Play. (This is now even easier to do thanks to the native integration with Google Play.)
ChartMogul provides transparency to the team
Soon after they started using ChartMogul, Meditopia began to see the value of the tool.
The team looks at multiple metrics to understand their performance. The most important KPIs they track include the following:
- active users
- subscriber growth
- MRR growth
- daily conversion rates
- free trials
- people who are about to churn in the next 7/14 days.
They use this data to understand what drives conversions and churn, to take action on that insight, and to forecast their future growth.
Using ChartMogul allows them to take action on these metrics, as soon as they notice a trend.
In addition, Berk says that cohort analysis (segmented by location and subscription plan) is a big feature for Meditopia because of the fact they operate in 7 main markets (defined by the languages they offer in the app).
ChartMogul helps us see all the important metrics in one dashboard and quickly understand where our business goes day-by-day.
Berk Yilmaz, CEO
Benefits beyond the boardroom
Berk is not the only person who uses ChartMogul to understand how Meditopia is developing and what initiatives need to be prioritized.
Our Product Manager relies on ChartMogul when they run AB tests — they keep an eye on how the experiments they’re running affect subscriptions and conversion rates and decide whether each test is a success based on this data.
Berk Yilmaz, CEO
The Result: Tracking and achieving against the North Star metric
The number of active subscribers is the most important metric the Meditopia team tracks on a weekly basis. Berk says that ChartMogul gives his team overall visibility and that directly contributes to achieving their top-line goals.
Since we adopted ChartMogul, we’ve grown our active subscribers over 5 times.
Berk Yilmaz, CEO
The insight ChartMogul provides drives business decisions for the Meditopia team. Operating in so many different markets is challenging because people in each locale can have very different reactions to a specific feature, plan, etc. The team always aims to learn about their audience in each market and optimize their plans accordingly.
That’s why Meditopia offers different plans for each market they operate in. AB testing and looking at retention data in ChartMogul allows them to find the best pricing structure for each language and country.
Berk says that the team routinely takes decisions about changing the pricing plans they use for different markets based on the data they get from ChartMogul.
Meditopia: Achieving a mission beyond revenue

The Meditopia team is on a mission to change the lives of millions of people around the world.
They want to reach as many people as possible all while running the business in a sustainable way. Finding the optimal monetization strategy is key.
ChartMogul plays a pivotal role in helping us find the sweet spot for growth and create a value-driven business that can reach and offer services to the highest possible audience worldwide.
Berk Yilmaz, CEO
