
If there’s one thing that all companies have, it’s data - and lots of it.
Data is only useful if you can act on it -- the more context you can add to your data, the more effectively you can act. This is the difference between generalized data gathering and analytics. ChartMogul helps businesses make use of that data by breaking it down through segmentation and visualizing analytics and metrics.
"The more context you can add to your data, the more effectively you can act."
A popular request from our customers is to be able to send data from Segment to ChartMogul. For many subscription businesses, Segment is an extremely useful platform for aggregating user and product data from many different sources. Segment is completely flexible, so it can accept any kind of data from anywhere.
There are many use cases for sending data from Segment to ChartMogul, such as:
- Pushing product usage data to ChartMogul to understand the impact of specific feature usage on churn rate
- Pushing user demographic data to ChartMogul to determine the key demographics contributing the most revenue
- Pushing marketing campaign data to ChartMogul to understand which campaigns are delivering customers with the highest average sale price
Using Xplenty, you can connect Segment (and virtually any other data source) to ChartMogul without any code. In this post we'll walk you through the steps to achieve this.
What is Xplenty?
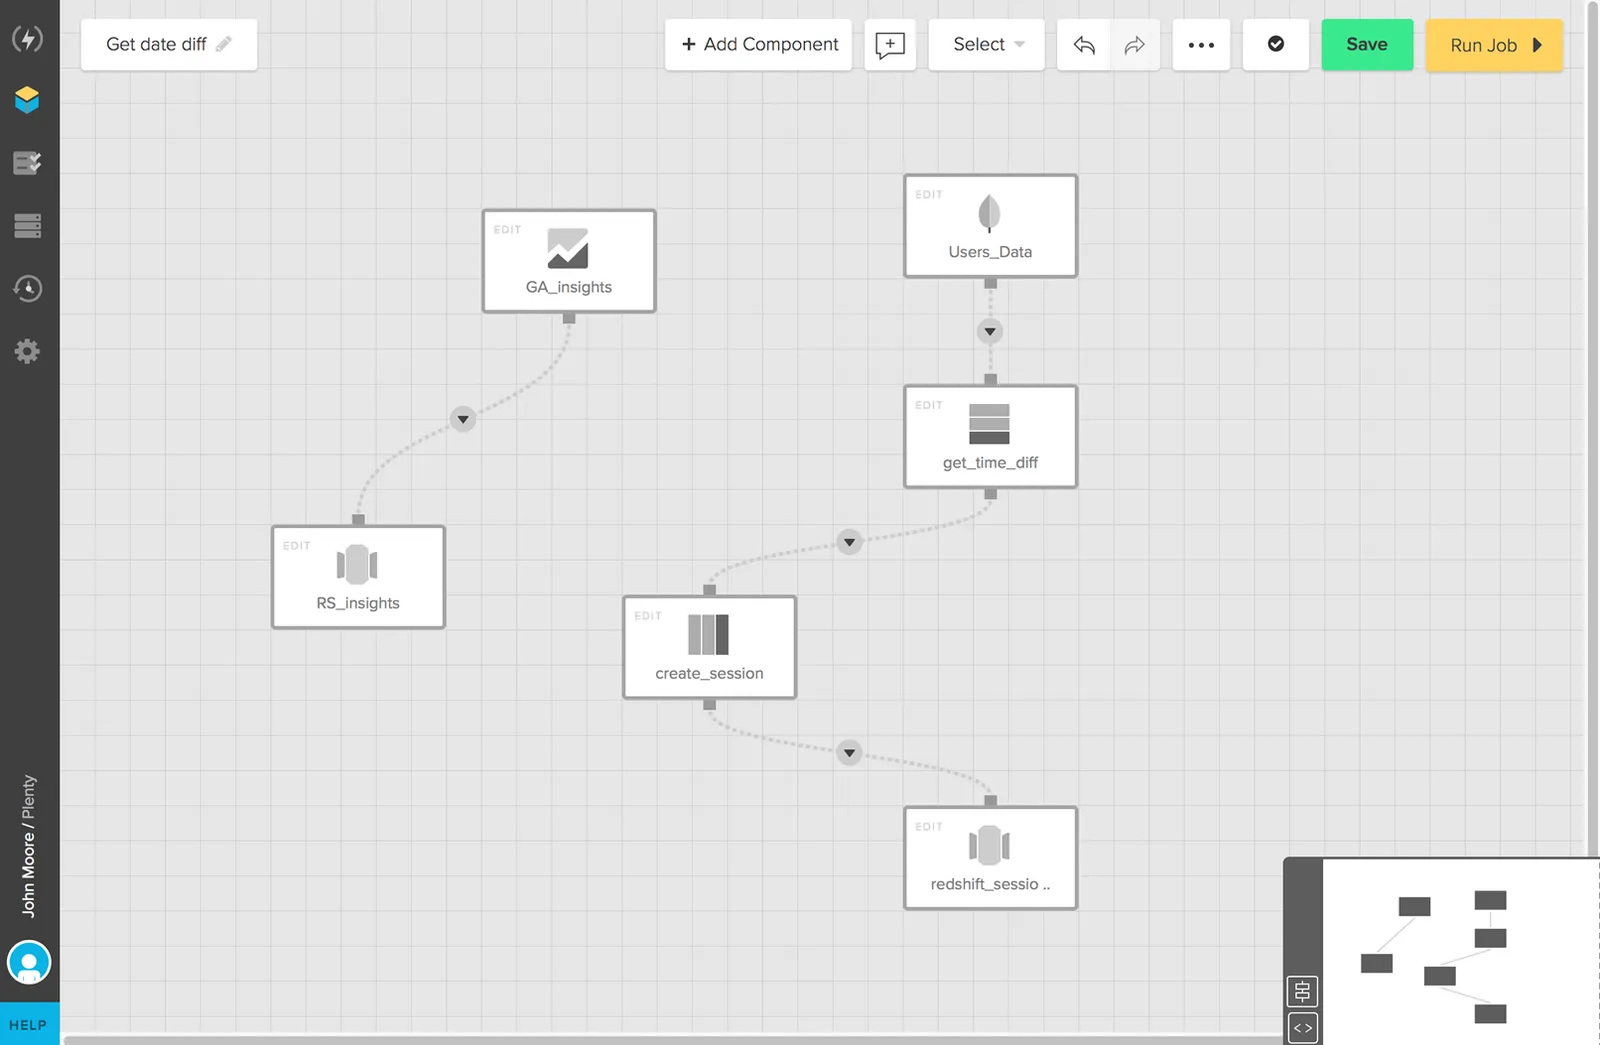
Xplenty is a data integration service that allows you to easily move data between different platforms and services -- all without writing any code. The Xplenty toolkit allows you to build such data connections using a visual drag-and-drop tool.
How to push data from Segment to ChartMogul
The Segment platform works with two types of endpoint:
- Sources (for collecting and aggregating data)
- Destinations (for pushing data to other services)
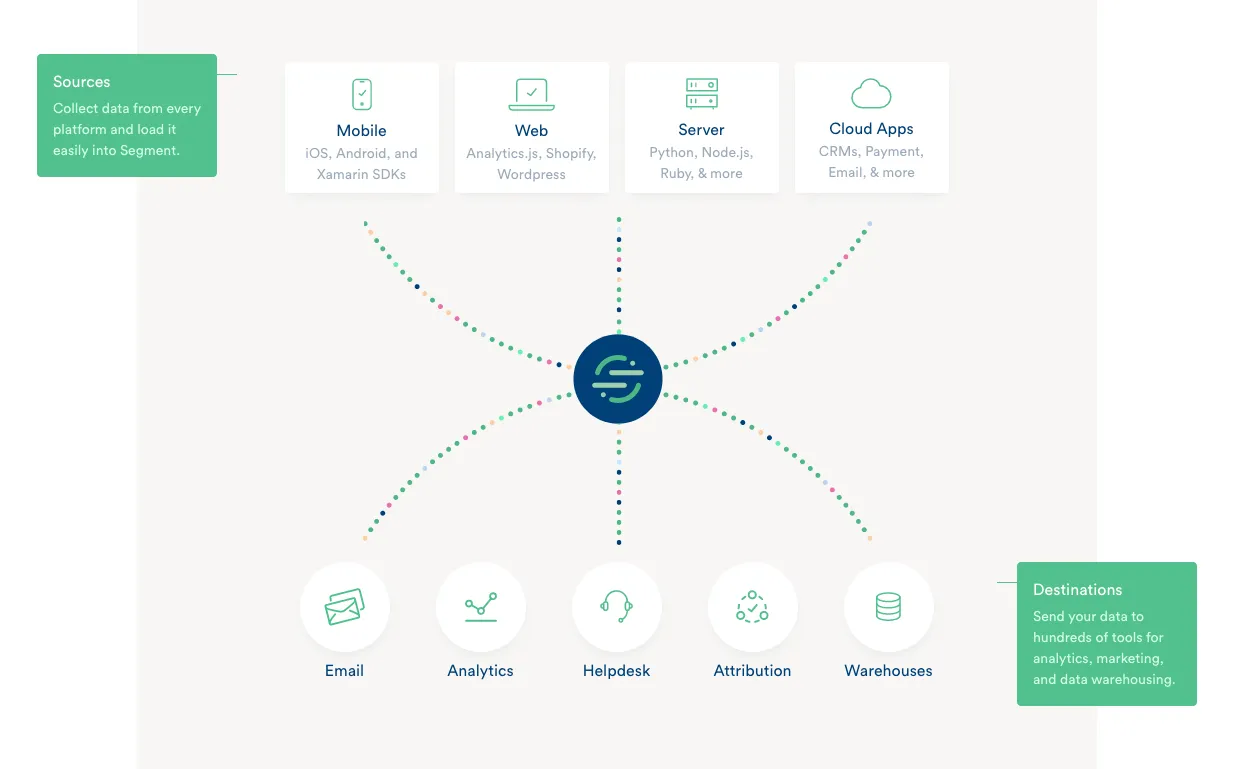
While ChartMogul is not currently a native destination for Segment, this post will show you how to achieve the same level of connectivity using Amazon S3 as a middleman. Pushing directly to an S3 bucket allows Xplenty to hoover up the exported data and insert it into ChartMogul using our API.
Note: If you're not using Amazon S3 account, you could also use an alternative service such as Amazon Redshift, Google BigQuery, PostgreSQL, etc. (but these are not covered in this guide).
At a high level, the data flow looks like this:
Segment -> S3 bucket -> Xplenty -> ChartMogul
Prerequisites
Before you get started with this integration, you'll need:
- An Amazon Web Services (AWS) account
- An Xplenty account
- A Segment account
- A ChartMogul account
If you’ve got all of the above in place, it's time to get started!
Part 1: Set up the Segment to Amazon S3 connection
For this part you need to follow the official Segment documentation for setting S3 as a destination. Come back here when you're done!
Amazon S3 Destination - Segment
Part 2: Set up Xplenty
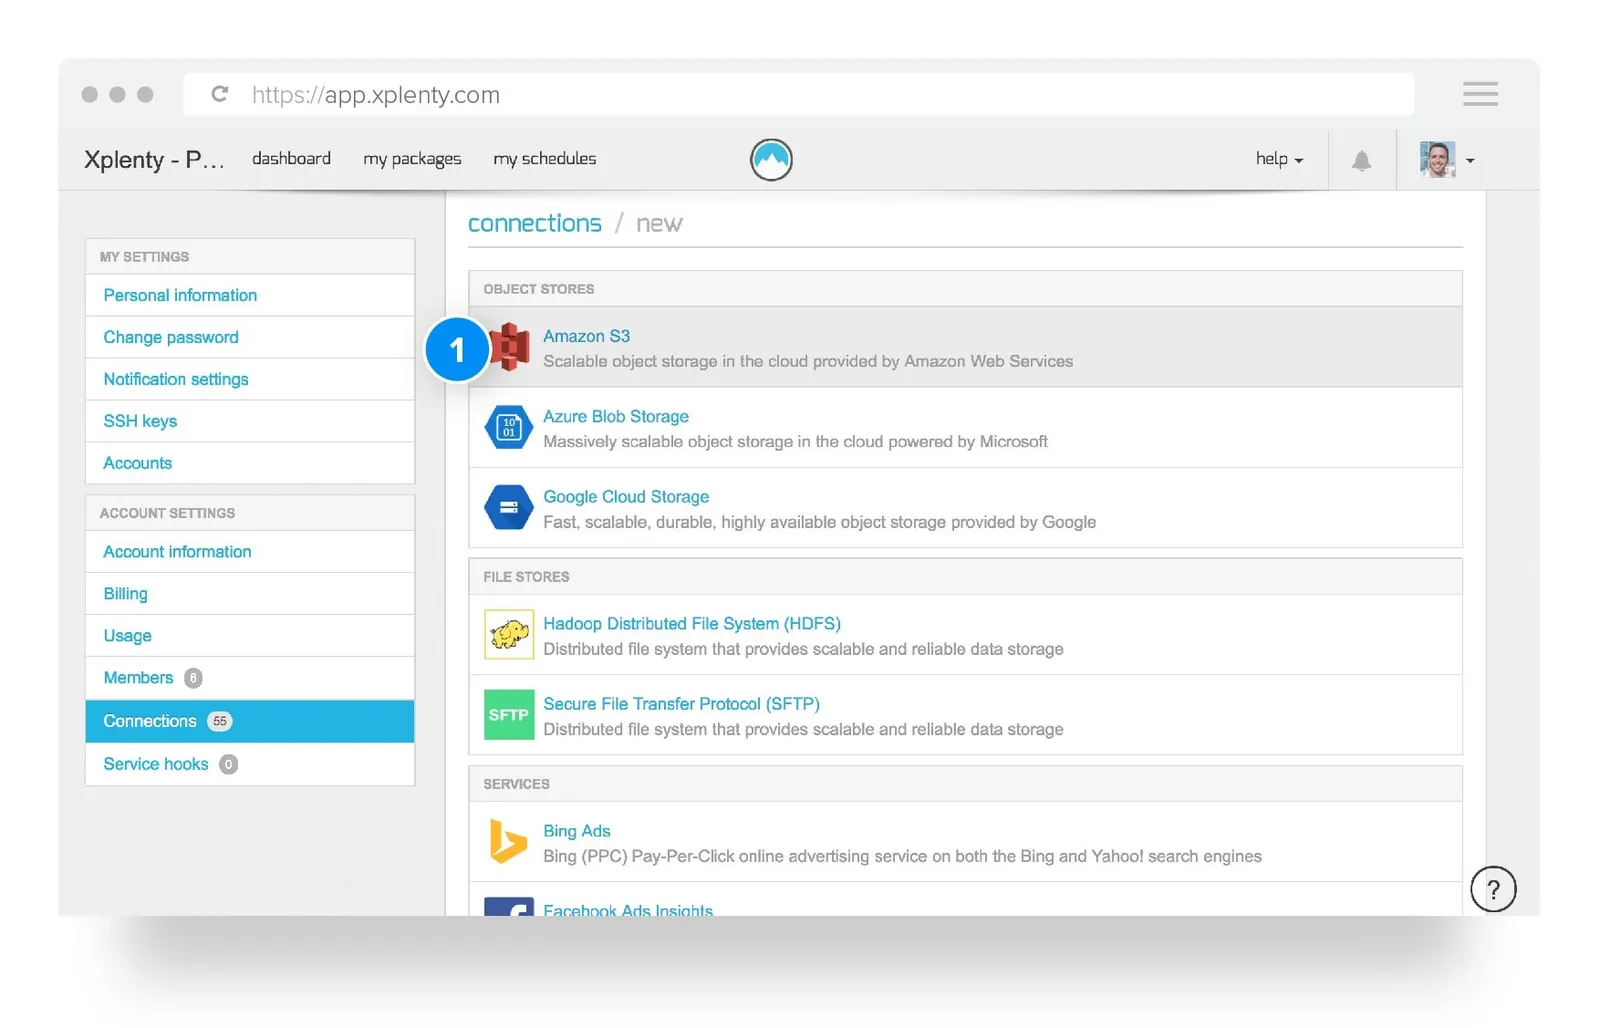
a. Create an Amazon S3 connection in Xplenty
Enter the connections section and click on the + new connection button. Then click on the Amazon S3 object store to configure your S3 connection.
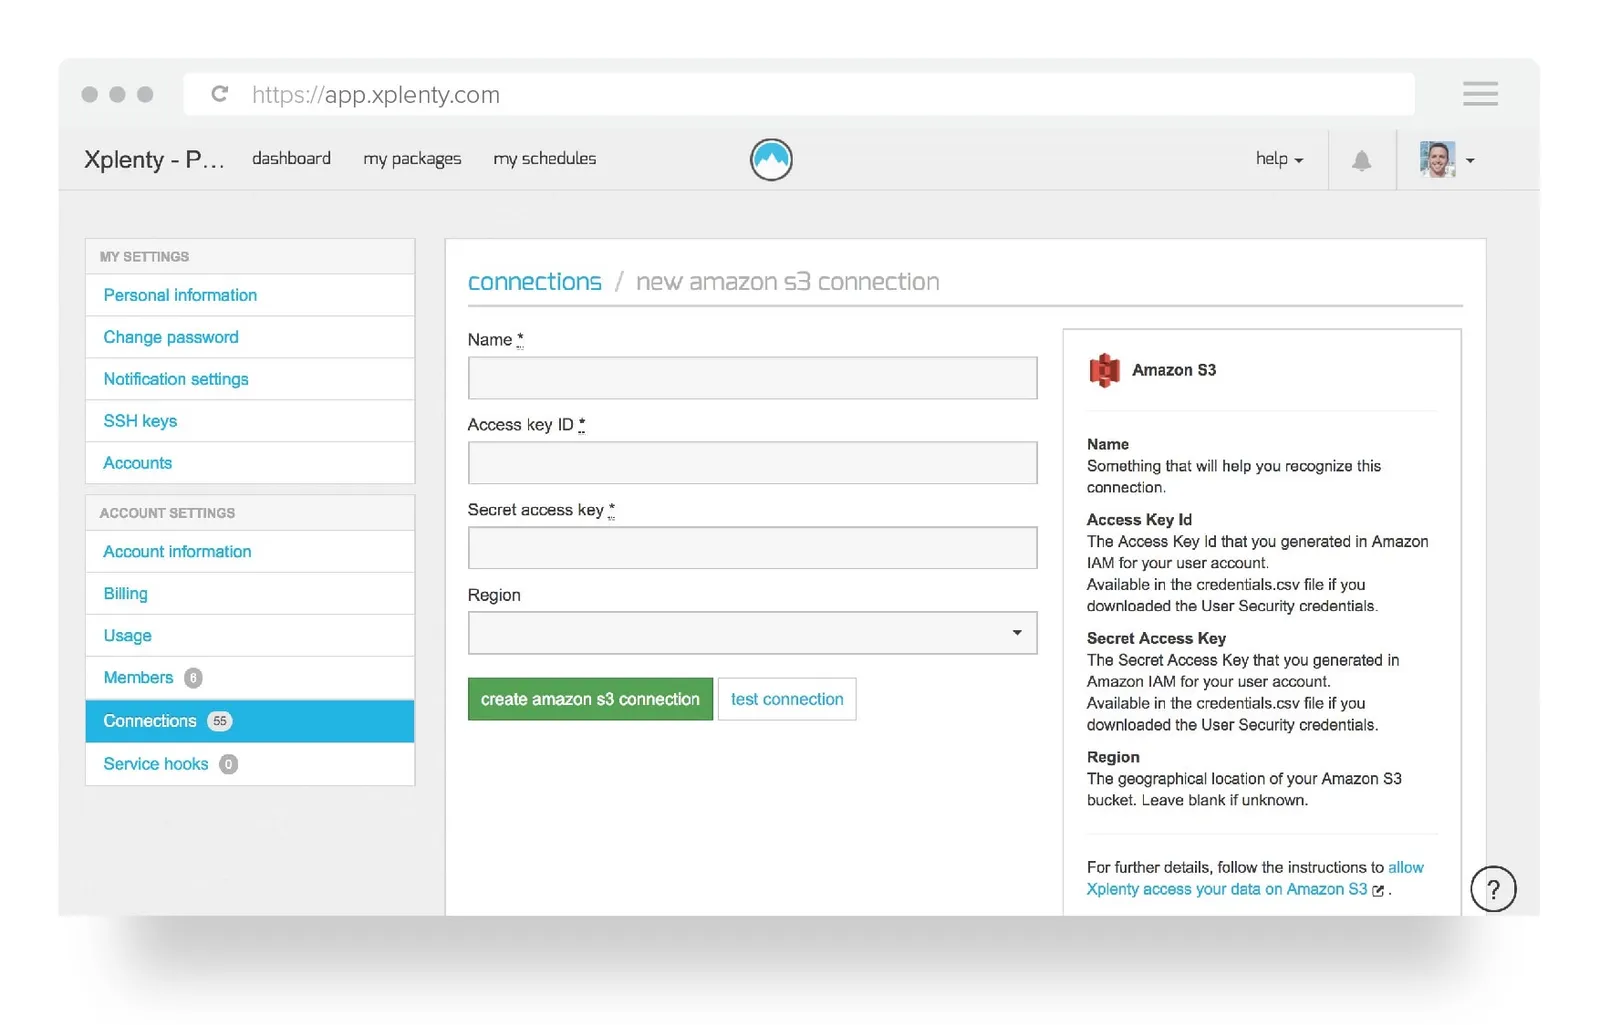
Insert your S3 details. See the explanation on the right of the page
b. Create your Segment to ChartMogul pipeline
Go to my packages located in the top navigation.
Click on the little arrow on the right side and choose From template…
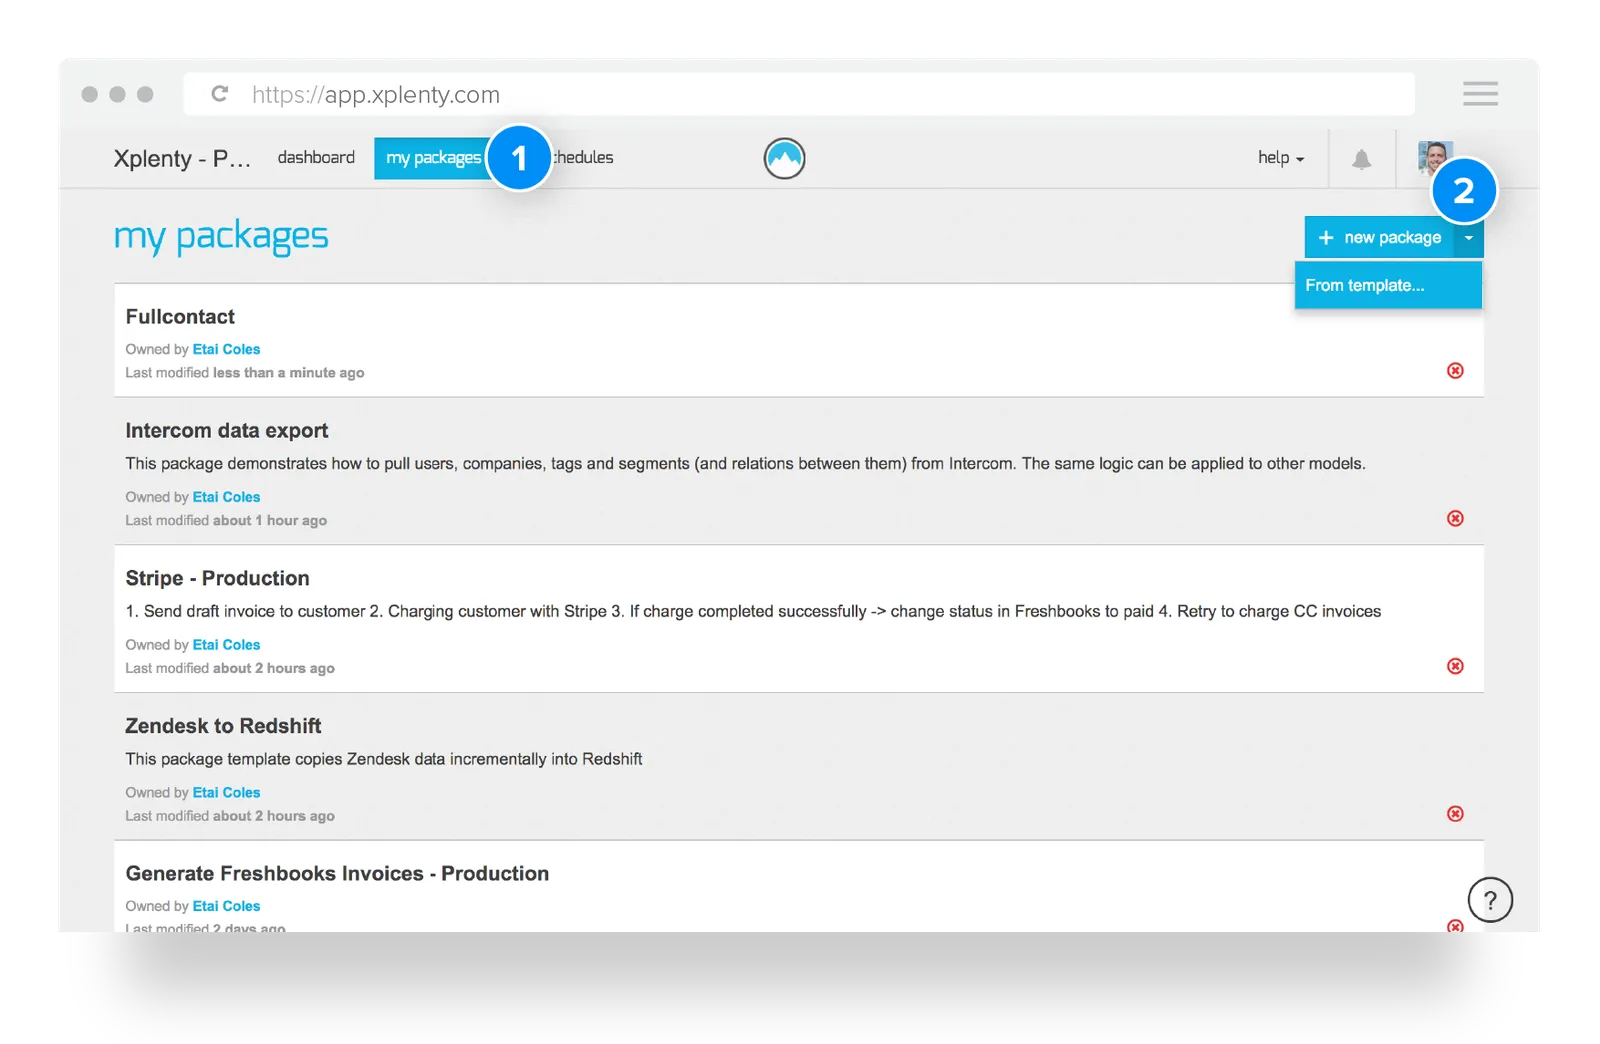
Select ChartMogul template from the list and click on Create Package.
This takes you to the package designer with the ChartMogul template created by Xplenty. Here you can create more pipelines, add transformation or do any data manipulation that you need to clean and organize the data. For this example don’t worry -- this has already been done for you.
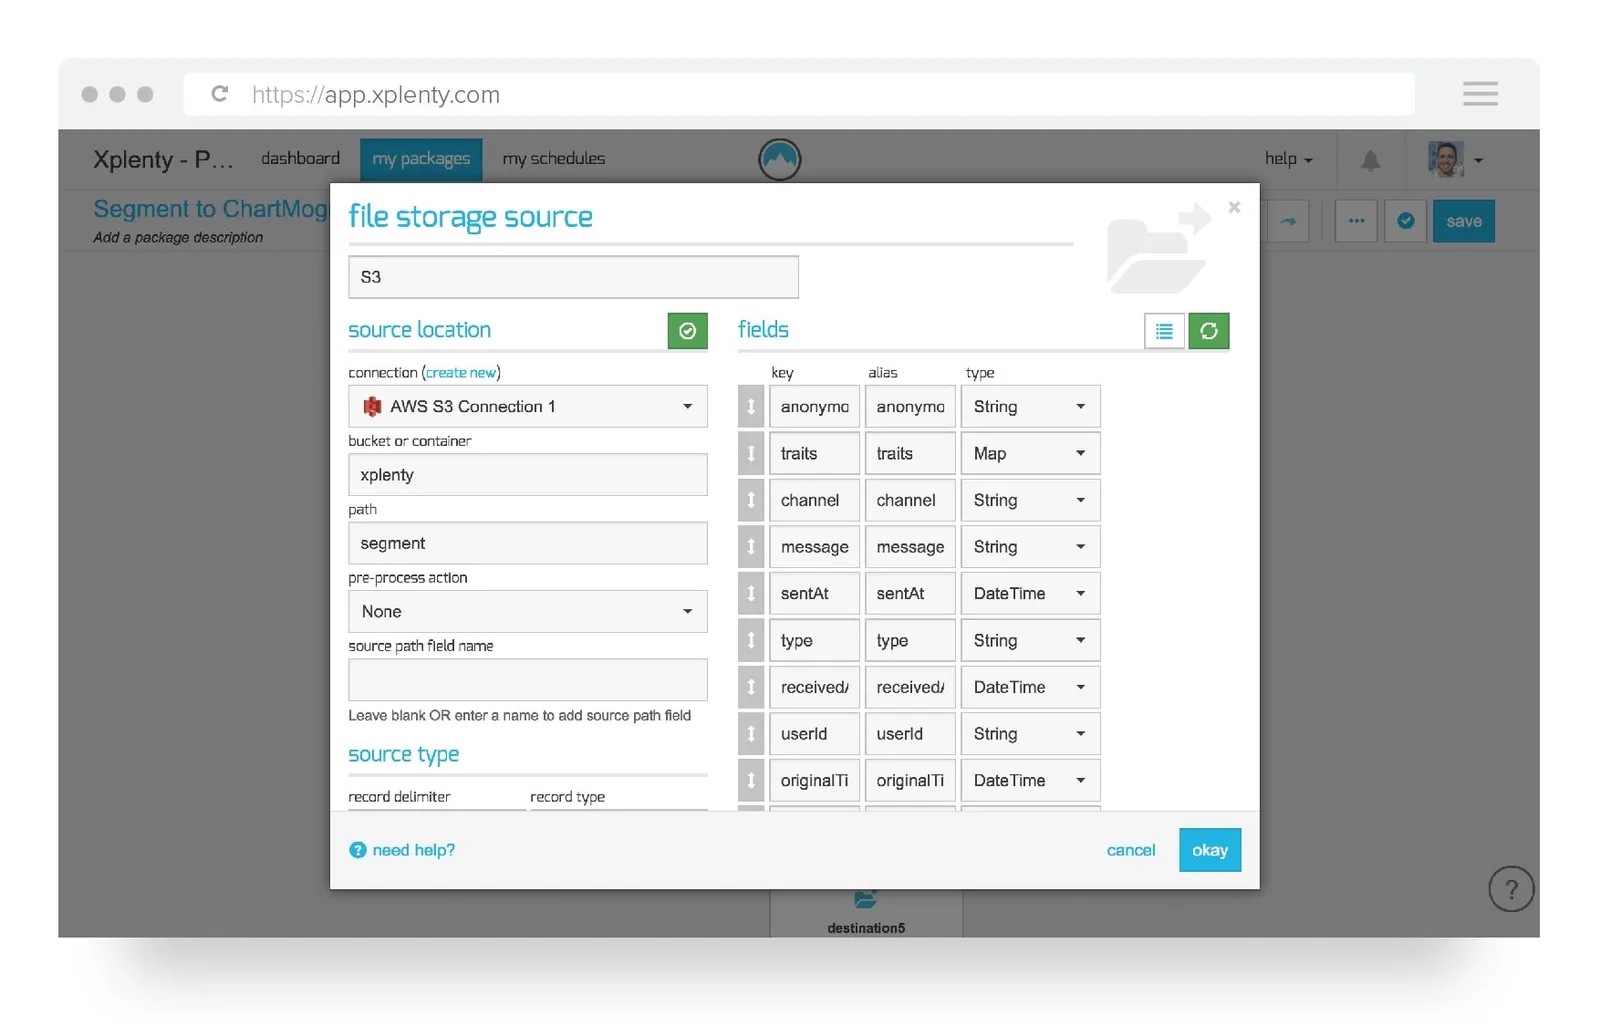
c. Read data from the S3 bucket
Define your bucket name and path from the S3 source component and click on the Auto-detect schema green button. You should get a list of fields. For further information please read the file storage source instructions.
With Xplenty’s pre-built functions, you can clean, aggregate and join so you can prepare your data before sending it to your ChartMogul account.
d. Send your data to ChartMogul
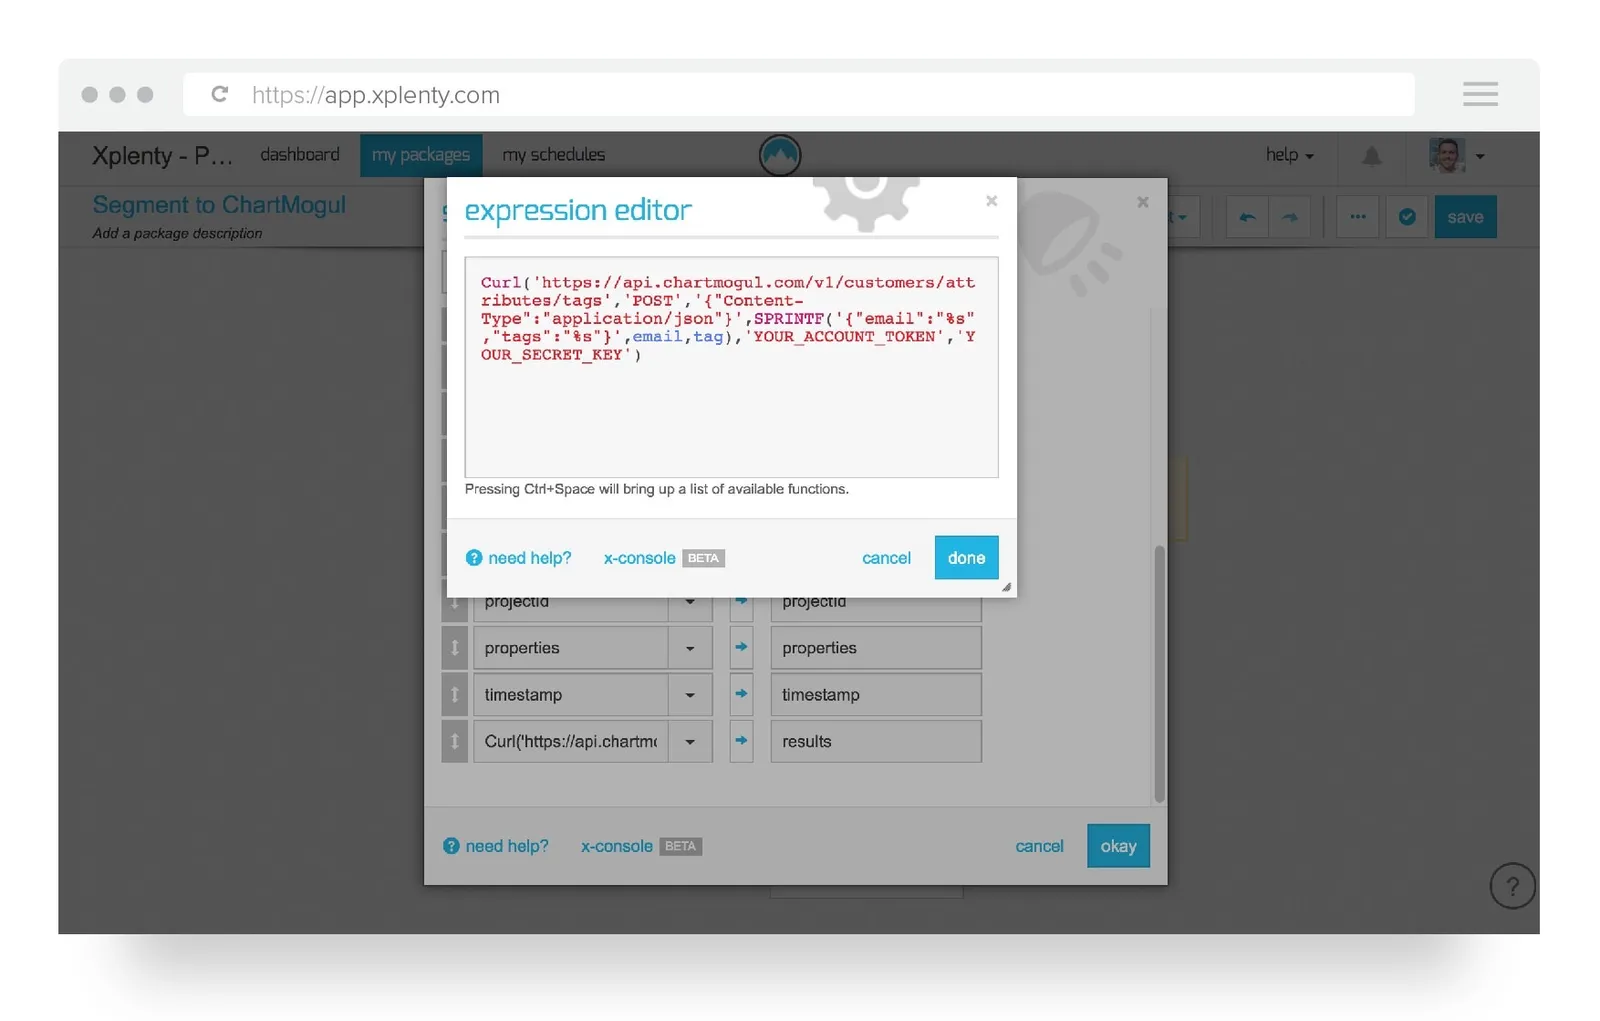
Xplenty, allows you to send any data supported by ChartMogul’s API into your ChartMogul account. In this example, we'll demonstrate how to add tags to your customers.
To add tags in ChartMogul, make sure you have the following fields:
- Email address
- Array of tags
- ChartMogul’s Account Token and Secret Key
In the results field in the ChartMogul component, determine the email and tags you want to send and add it to the CURL call.
Here are few examples of tags you can add to your customers:
- Signed up through certain marketing campaign
- Product usage information (e.g., "has interacted with feature X")
e. Validate and run your pipeline
In the upper right corner of the package editor, click the blue check mark button to save and validate the package. After the package completes validation, navigate to the dashboard.
In the dashboard, find the cluster that is now available. Click the execute button and choose the package to execute.
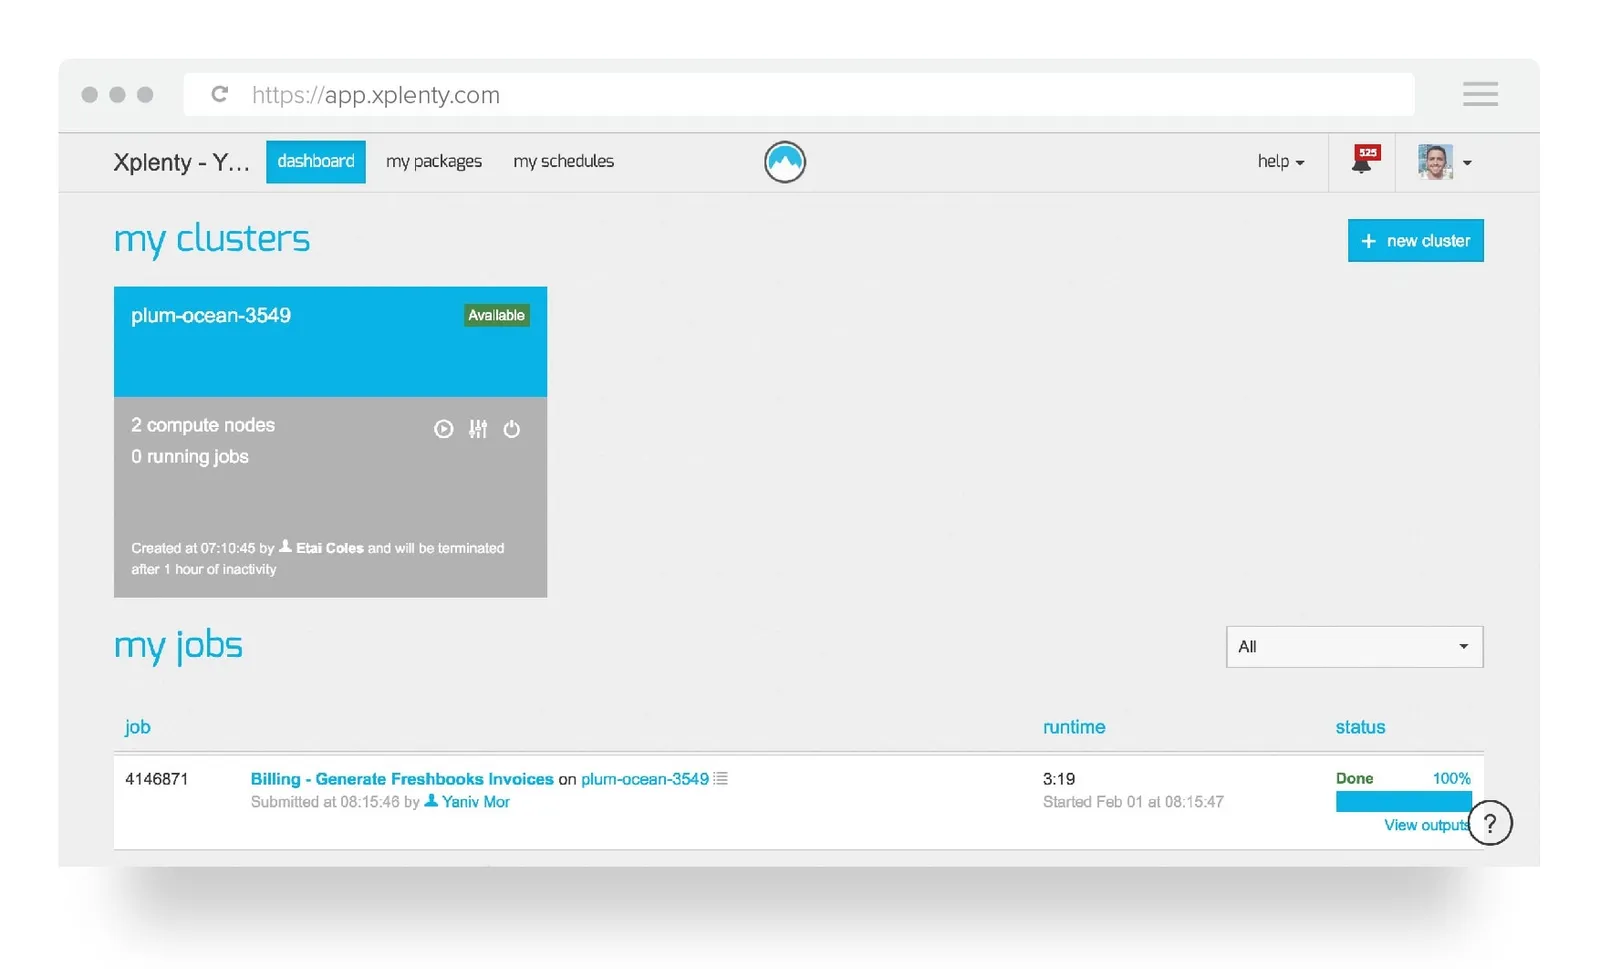
Congratulations, you have completed your first job!
Part 3: Create segments and view your data in ChartMogul
To analyze our product usage data in ChartMogul, you need to create custom segments based on the data pushed from Xplenty.
Let’s say we want to analyze customers who haven’t used a specific feature of our product we call Turbo Charts. In doing this, we’ll be able to see whether metrics like churn rate are impacted by using this feature.
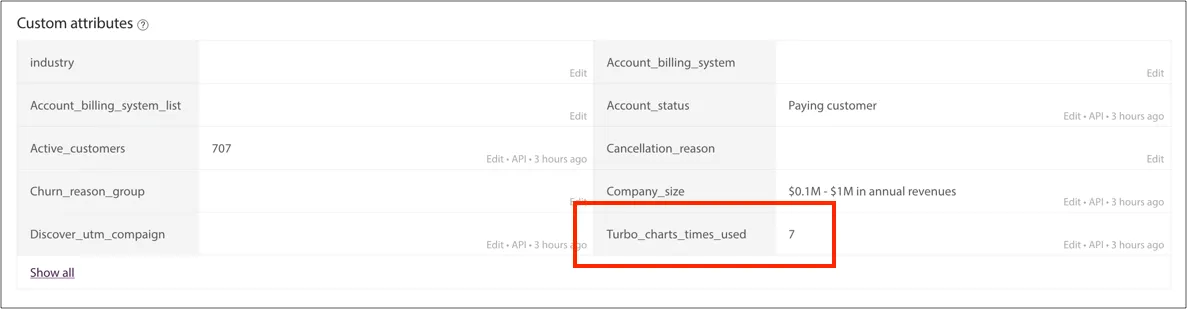
To achieve this, we’ll assume we’ve pushed an attribute to ChartMogul with the name turbo_charts_times_used and a numeric value representing the number of times a user has interacted with the feature.
Once you’ve added an attribute to a customer in ChartMogul, it will appear on their customer profile:
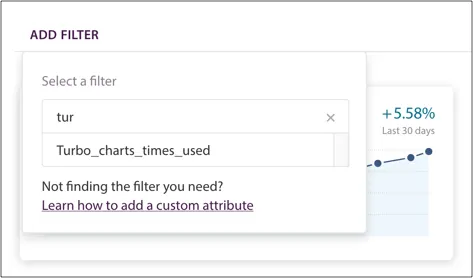
And in the Add Filter drop-down menu:
Now let's look at our churn rate and filter it to a specific segment based on this attribute:
- Log in to your ChartMogul account and navigate to the churn rate chart
- Click Add filter and choose the turbo_charts_times_used attribute you defined earlier
- Select equals and 0 for the value
- Click Add to see the filter applied
You’re now looking at the customer churn rate for users who have never used the Turbo Charts feature. Once you’ve applied the filter, you can save it as a segment by clicking SAVE SEGMENT.
To take this a step further, you can compare this to users who have used this feature:
- Click NEW SEGMENT
- Click Add filter in the newly created segment and select the same turbo_charts_times_used attribute
- Choose Greater than and 0 for the value
- Click Add
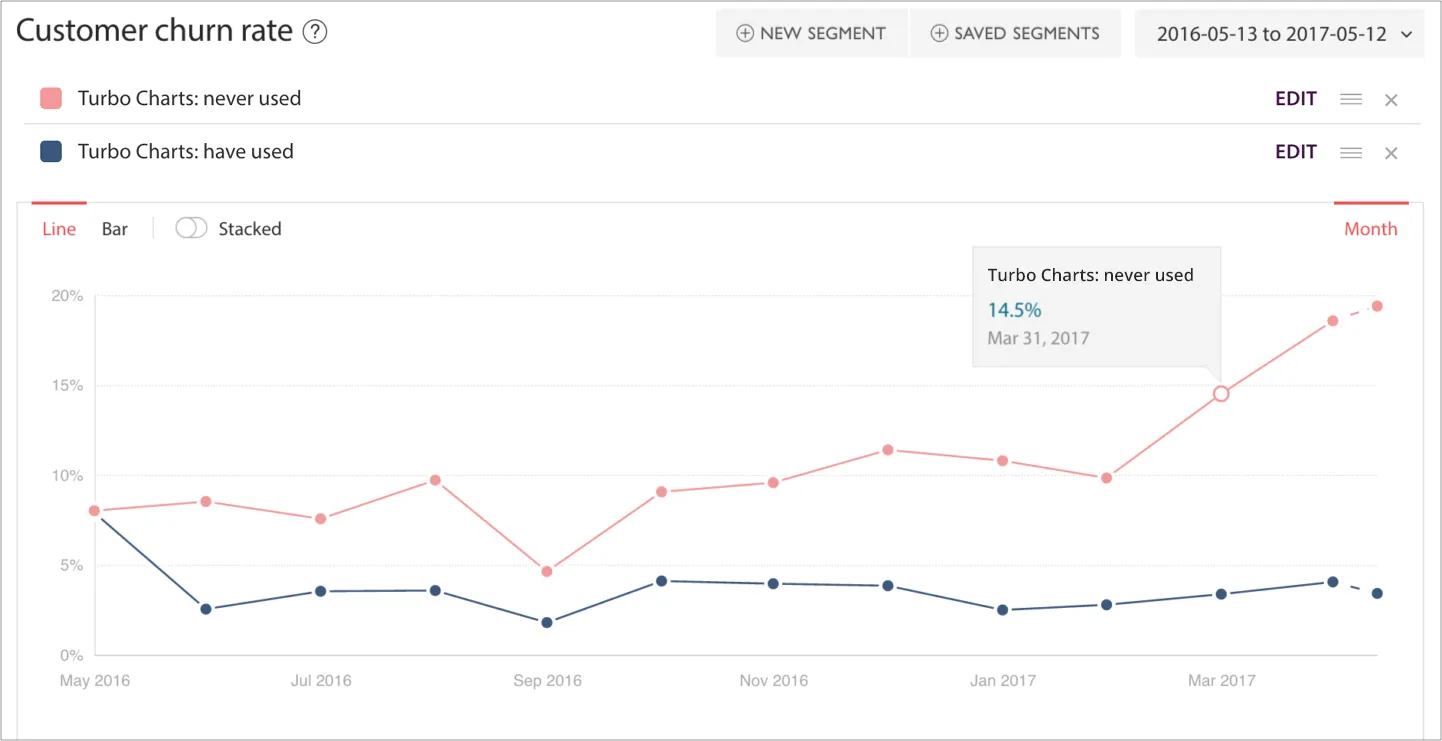
You’ll now see a churn rate for both segments drawn on the chart, comparing users who have used the feature at least once with users who have never used the feature.
Here we can see that there's clearly an elevated churn rate for customers who've never used our fictional Turbo Charts feature:
Summary
Pushing data from Segment is just one example of using Xplenty to easily build zero-code integrations and access data where you need it.
If you're connecting other data sources to ChartMogul to use with segmentation or to inform your decision making, let us know! We'd love to hear what you're doing. Get in touch at support@chartmogul.com.
Thanks to the team at Xplenty for highlighting this use case and supporting ChartMogul on their platform.