Ryan Mesches is using ChartMogul to measure the effect of the Partner Program on the company’s bottom line.
What is Teamwork?
Teamwork is on a mission to make teams around the world “efficient, organized, and happy.”
We’re not just providing a (set of) product(s), we want to provide a solution to a business problem.
And that problem is organizing and managing teams — often split across multiple locations and time zones.

Teamwork customers can use 5 distinct products to organize their work and improve performance:
- Projects is the flagship product that helps anyone from small teams to large enterprises with project and work management;
- Desk empowers teams to manage conversations with customers;
- Chat is a tool for internal synchronous communication;
- Spaces allows teams to upload and share internal documentation;
- CRM is a sales pipeline tool geared towards people coming from email and Excel.
The team consists of over 250 people, split between 8 offices with about a quarter of the workforce working remotely.
We spoke to Ryan Mesches, who leads Teamwork’s Partner Program to learn about how he uses ChartMogul to manage the program and show its contribution to the company’s bottom line.
Teamwork’s Partner Program
The purpose of the Partner Program is to facilitate some of the onboarding, training, and enablement inside the organizations that choose Teamwork.
Ryan shares that bigger organizations typically expect a bit of extra help to get started with Teamwork’s products.
They might be using a legacy piece of software that requires custom integration and/or data migration. Or they might need help aligning existing internal processes with the capabilities of Teamwork’s products.
In such cases, the customer success team steps in and helps new customers get onboarded. Partners add an extra layer, which is a great fit for those companies that have a unique set up or require specific customization.
An example of a typical partner is OneMotion. Teamwork customers work with OneMotion to help them with things like:
- developing a process for migrating to and using Teamwork’s product suite;
- getting buy-in from leadership to have the whole company switch to the new set of tools;
- and finally to provide training for the team on how to use the new software.
Teamwork’s Partner Program has 3 primary types: sales, enablement, and technology partnerships. Some partners (such as OneMotion above) provide a blend of all 3, but by far the biggest focus is on partners that help new customers to make the best use of Teamwork’s products.
Teamwork introduces customers to their partners because it helps with retention and expansion when it comes to those users. Customers, attached to a partner, have a higher LTV and churn less often.
In 2020, Ryan and the team plan to expand the Partner Program and using it as an acquisition channel as well.
Having such high confidence in the effectiveness of the Partner Program wouldn’t have been possible without a reliable way to measure its performance.
The Challenge: Measuring the impact of the Partner Program
Early in the life of the Program, Ryan and the leadership team knew that partners were driving results, but it was hard to give exact details about the impact on the bottom line.
Before ChartMogul, Ryan was using Excel to pull data and try to match it to customers and partners to prove the viability of the program. Since the data “lived” in so many different places, it was nearly impossible to build a tracking model, which made it hard to trust the numbers Ryan was presenting.
Each week, I would share how many “introductions” we’ve made, i.e. how many customers we sent to our partners, and people from the team would say “That’s great, but why is it important?”
All the numbers were living in different places — Excel, the CRM tool, custom tracking solutions — it was taking Ryan a lot of time to constantly keep them up to date. In addition, with a new CFO and Sales Director coming in, there was a steady stream of questions directed at Ryan about the numbers and the overall effectiveness of the program he was responsible for.
I knew that constantly compiling numbers and answering questions about them wasn’t an efficient use of my time.
He needed a better way to measure and present the effect of partnerships and ChartMogul gave him an easy and reliable way to achieve that.
The Solution: ChartMogul provides Teamwork with a single source of truth
Ryan shares that switching to Stripe for automated billing and Worldpay for custom invoicing allowed Teamwork to clean up their billing data and streamline it within ChartMogul.
This also allows him to better track and understand the effects partners have.
Every week, Ryan logs into ChartMogul and adds a custom tag to all customers who are working with a specific partner.
This lets him compare those customers to those who never get introduced to a partner — and not just in the initial sale, but also how they grow over time.

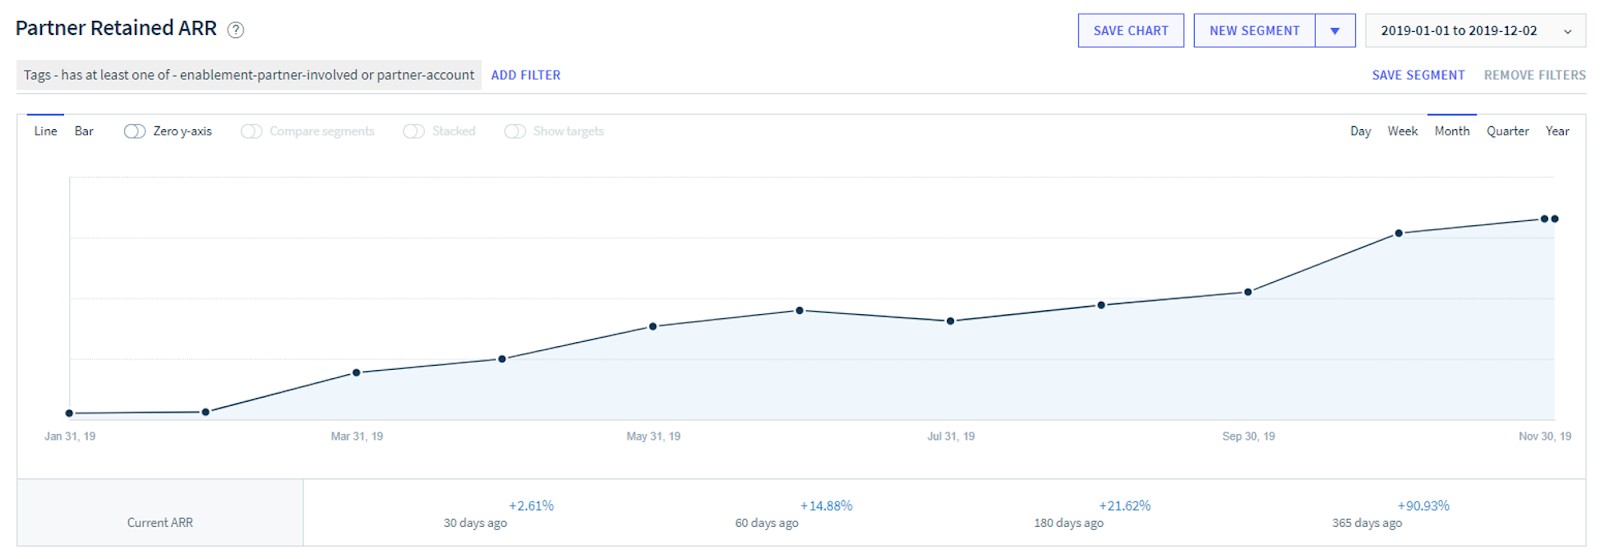
Ryan’s current focus is on a metric he calls “Partner Retained ARR” — ARR from customers who are working with an enablement partner.
Tracking the number within ChartMogul is incredibly easy — all they needed to do was to create a segment based on an “Enablement partners” tag Teamwork has within their account.
Thus, Ryan reports a single number in his weekly report, which comes straight out of ChartMogul — no additional stitching and merging required.
Ryan admits his work would be much harder if other people on the team didn’t trust the numbers; luckily, there’s buy-in from the C-level and everyone at the company treats ChartMogul as the single source of truth when it comes to revenue data.
Ryan still looks at top level numbers such as the number of intro’s made, how many partners they have in their ecosystem, as well as the performance by sales rep. These numbers, however, just add color and insight into what they already know about their Partner Program from tracking core subscription data.
Ryan still gets the occasional question from co-workers:
Now I can just respond by sending them a link to the respective report in ChartMogul. That doesn’t just make my life easier — it also helps them understand how our business is doing.
The Result: ChartMogul leaves no doubt about the viability of the Partner Program
These days Ryan walks into weekly meetings with a lot more confidence. Rather than talking about tangential metrics such as intros made, he can show hard numbers on how partners are affecting Teamwork’s bottom line.
In addition, he’s also experimenting with tracking customer ARR by the partner and bringing that insight into leadership meetings. This allows him to explain why so much time is spent on a given partner.
Using ChartMogul also saves Ryan a lot of time:
Every time I get into a customer profile and see all the movements, I realize it would have been a nightmare trying to track it on my own.
Next steps: Automation and deeper insight
Even though the setup is useful in helping Ryan manage Teamwork’s Partners Program, he openly admits it’s in no way perfect.
That’s why Ryan has already identified potential improvements and optimizations.
For example, the current setup still involves a fairly large element of manual work — every Friday Ryan goes into ChartMogul and tags customers who’ve been paired with or referred by a partner.
He knows this can be automated fairly easy — by using Zapier, for example. But before they can do that, they need to make some changes to their backend system.
Another improvement Ryan wants to introduce, is to develop a deeper understanding of how partners affect customers’ LTV and propensity to churn. To do that, he’s experimenting with ChartMogul’s segmentation features to identify (groups of) similar customers where the only difference is whether they’re linked to a partner or not.
Ryan believes this will provide an opportunity for Teamwork to understand the effect of the program, so once they are ready to expand their marketing and sales ops, he can make the point that the program he’s running can drive results for the bottom line of the company.
ChartMogul isn’t reserved just to the CEO and CFO offices
Ryan’s experience shows that ChartMogul can be used by any team or department in a subscription company.
On the surface, it’s a clever and faster way to collect and analyze data.
But once we look deeper, we understand that Ryan and his team are gaining unique insight, which wouldn’t be available to them if they were using a spreadsheet.
The ability to see how customers’ relationships with your company evolve as time goes by gives you deep insight into your business.
To Teamwork this is about a lot more than just tracking numbers — it’s about making informed decisions about their business.
