
Introducing Ahoy
Ahoy is an open source project developed by Instacart. According to its Github description:
Ahoy provides a solid foundation to track visits and events in Ruby, JavaScript, and native apps.
I like to think of it as a bit like having the backend of Google Analytics and instead of rendering charts in a UI, it dumps everything into a database of your choosing (we have a dedicated box with PostgreSQL for this purpose). This means that we can more easily access information on our visitors.
What do we want to achieve with Ahoy and ChartMogul?
Using the data gathered by Ahoy, we can start to track the earliest stages of our user funnel and get a more complete picture on where our customers are coming from (attribution), more specifically tracking the point at which they first come into contact with our brand.
Most SaaS businesses today partake in a wide range of marketing activities spread across a large number of platforms on the web. The ability to track how each of these impact the bottom line is critical when optimizing your marketing strategy.
I want to be able to answer these 5 questions inside my ChartMogul account:
- Which discovery sources produce the most paying customers?
- Which discovery sources produce customers with the highest MRR or LTV?
- Which landing pages ultimately produce the most paying customers?
- Which conversion sources produce the most paying customers?
- Which discovery sources produce customers with the lowest churn rate?
It should be quite obvious to anyone working in a marketing or revenue generation role at a subscription business that being able to answer these questions (even 'somewhat' accurately) would be extremely valuable.
How it's going to work
- You embed some JavaScript from Ahoy on your website, just like you do for Google analytics.
- This JS tracks all the same visitor data that Google Analytics tracks and sends the raw data to the Ahoy application which writes the visitor event data to a database of your choosing. The JS also cookies the user so all data collected is associated with the same person (or at least the same browser/machine).
- As soon as any visitor signs up for an account (trial, paid, freemium, doesn't matter), you'll then want to fire off a webhook from your backend to the Ahoy application informing it that a user has signed up for a free trial - the webhook would collect the Ahoy identifier from the cookie as well as the internal ID of the user account. As soon as that's done all the previously collected data about the site visitor will be associated with the newly created user account.
- We can then send the relevant pieces of data to ChartMogul using the Enrichment API, each time time a trial converts to a paying customer - if the visitor doesn't have a free trial then the feedback loop is even faster and you can associate the visitor data with the customer as soon as they signup.
Setting up Ahoy
There are three main parts to setting up Ahoy:
- Setup a separate server and database and install the Ahoy application there.
- Paste the Ahoy javascript embed into your website's code.
- You'll need to custom code a callback/webhook that will fire each time a visitor signs up on your website and a user account is created. The idea here is to 'close the loop' and associate the visitor data that's being collected by Ahoy with the user account in your database.
Pushing Ahoy data to ChartMogul
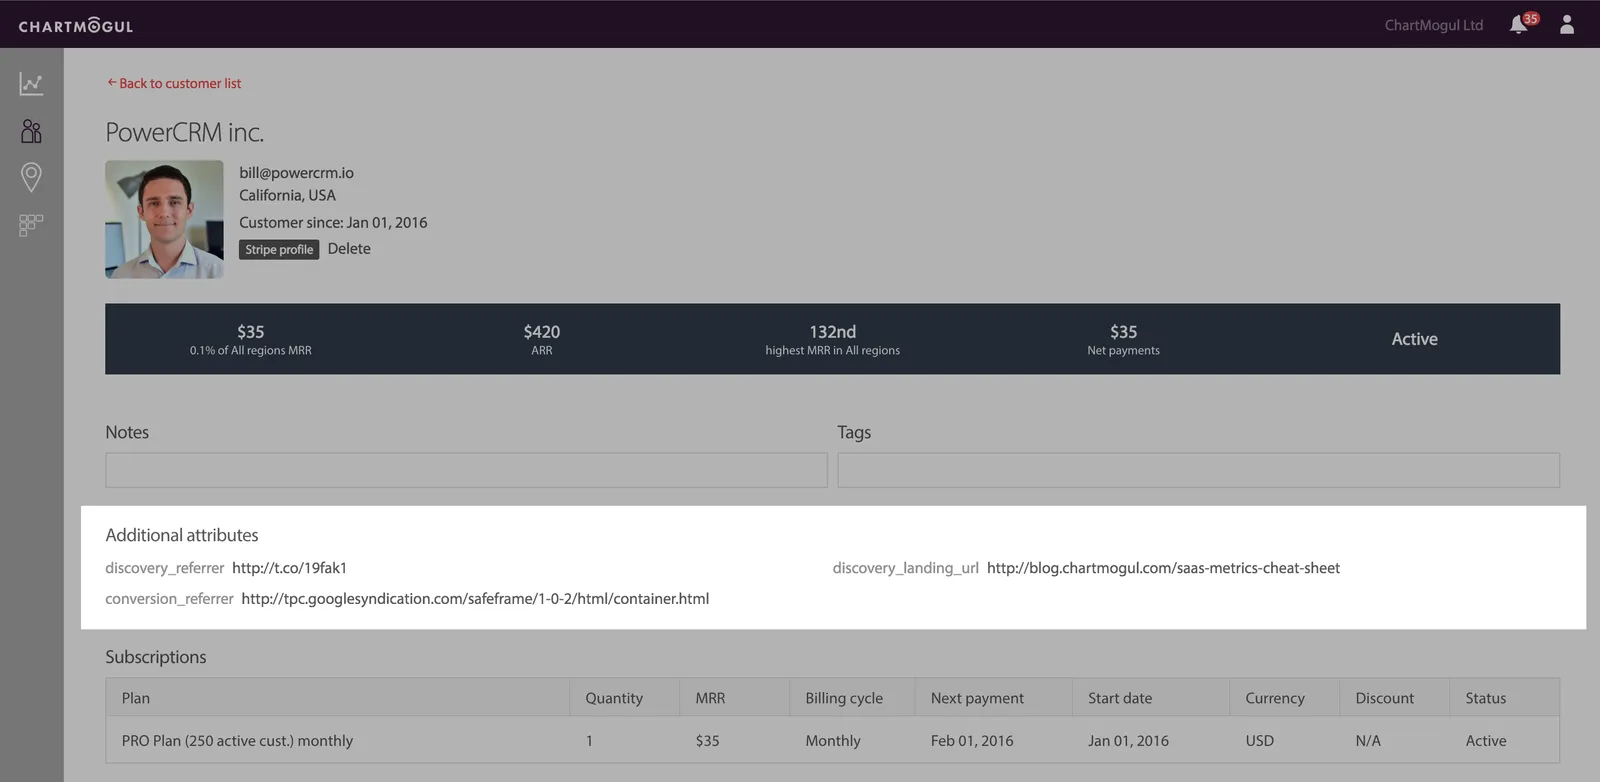
Once you've completed the above steps you'll want to use the ChartMogul Enrichment API to push the relevant bits of data (discovery referrer, discovery landing url and conversion referrer) to your ChartMogul account each time a new customer is added.
You will start to see the Ahoy metadata appearing on your customer profiles in ChartMogul:
Segmenting your metrics in ChartMogul using Ahoy data
You are now ready to create some very insightful graphs in ChartMogul.
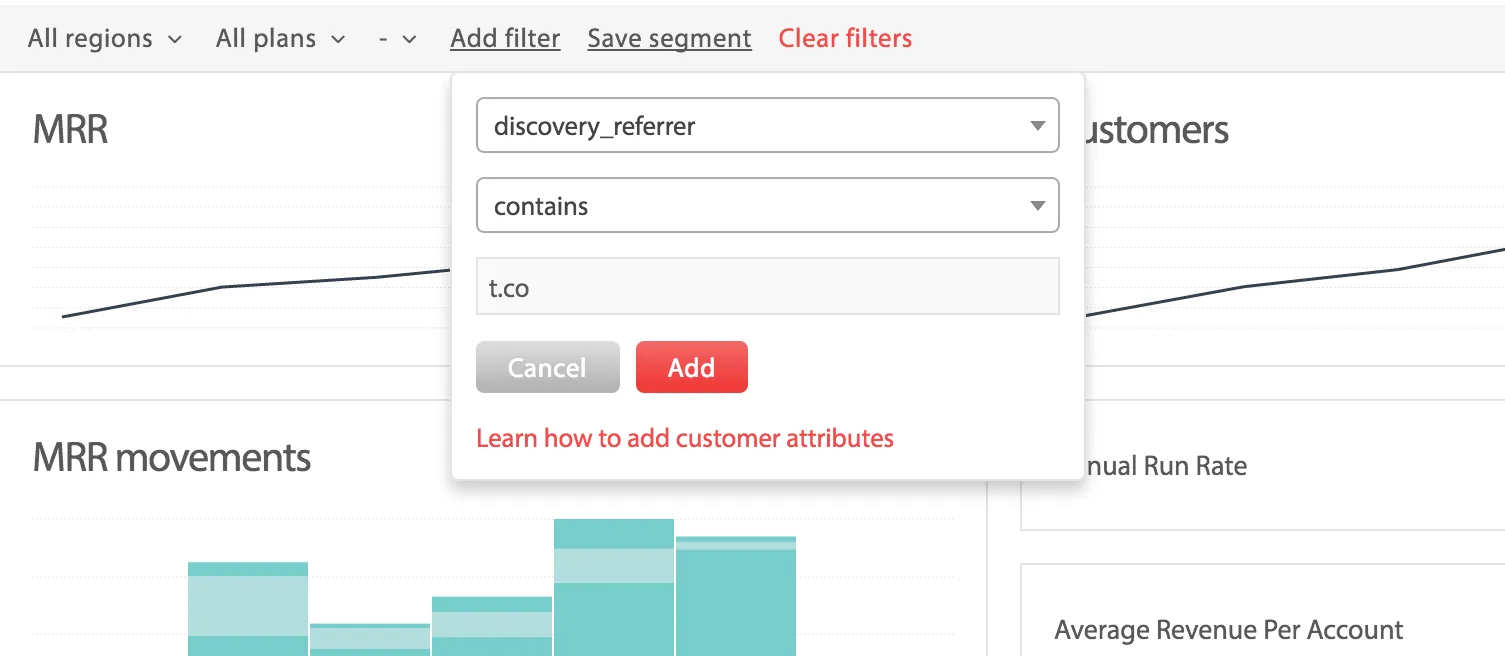
Click "Add filter" and setup like this:
discovery_referrer
contains
t.co
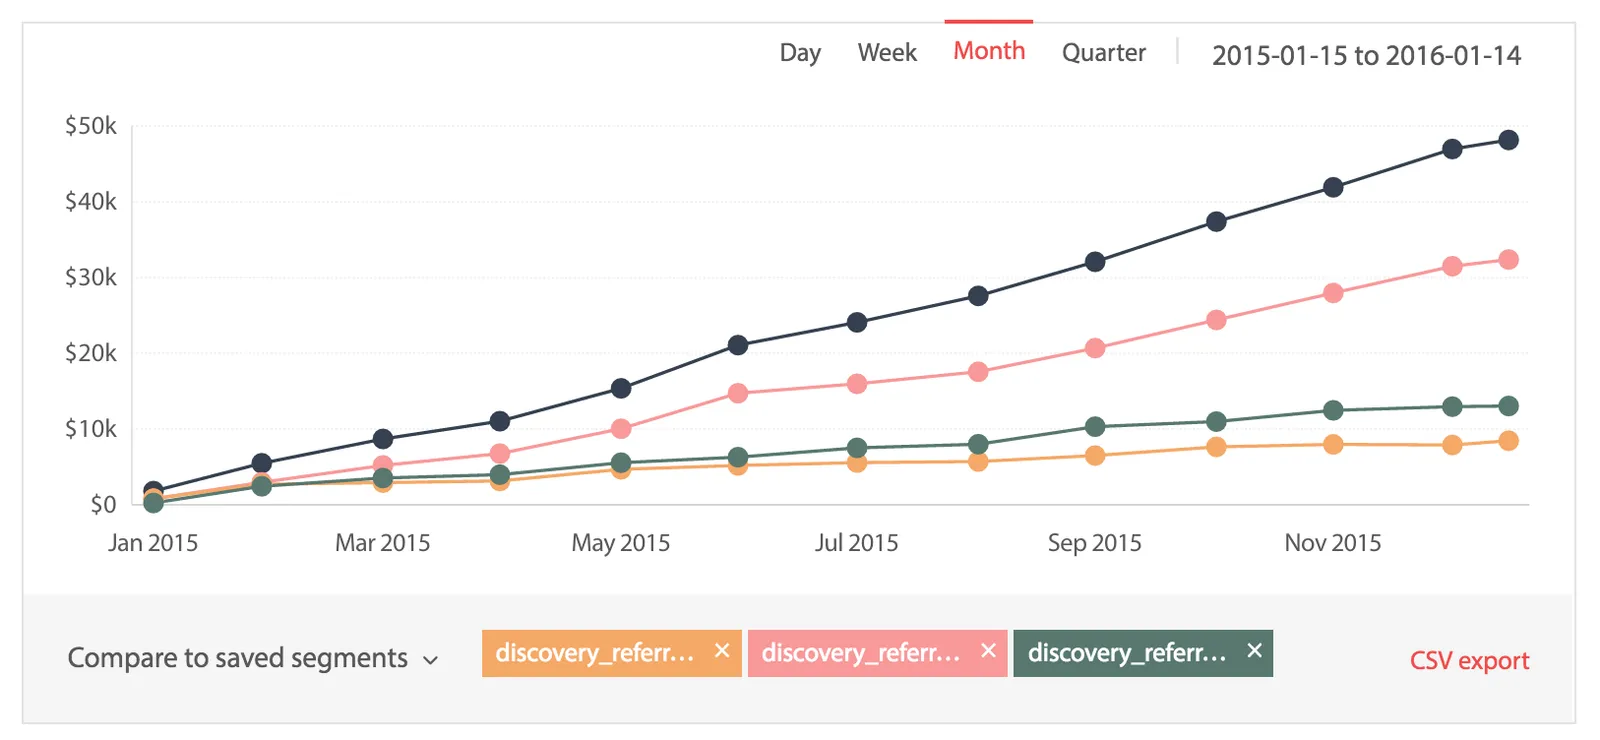
Once you've achieved this setup, you can add further segments that would be interesting to you - and even compare them directly:
Some limitations
As always, when tracking and attributing users on the web, you're always going to run into a set of common issues. People commonly use different devices and browsers on the web, and using cookies to track users across those devices isn't really feasible. You should bare in mind that the data you get will never be 100% accurate. You'll end up with some traffic that looks like first-time visits and will actually be users who have, for example, come into contact with your brand on a mobile device and then moved to a desktop browser.
With that in mind, it's clear that the insights you can gain from implementing and using such a system vastly outweighs its drawbacks. Being able to attribute your customers right back to their first touch-point with your brand can answer countless questions and guide your focus and spending when it comes to sales and marketing.