Director of Finance Ken Carlson on how Whereby is making freemium work thanks to actionable insight derived from their revenue data.
What is Whereby?
We can say that Whereby is a video conferencing tool, but that wouldn’t even start to cover the real picture. Whereby defines its mission as “We exist to create spaces for people to live and work with balance”. In order to achieve that, they are building the most straightforward and easiest-to-use tool to hold video meetings in the world.
Ease-of-use is one of the most important features, but not the only one that’s crucial to fulfilling this vision. Whereby integrates with tools like Google Docs, Trello, and Miro and allows users to embed them directly into video calls.
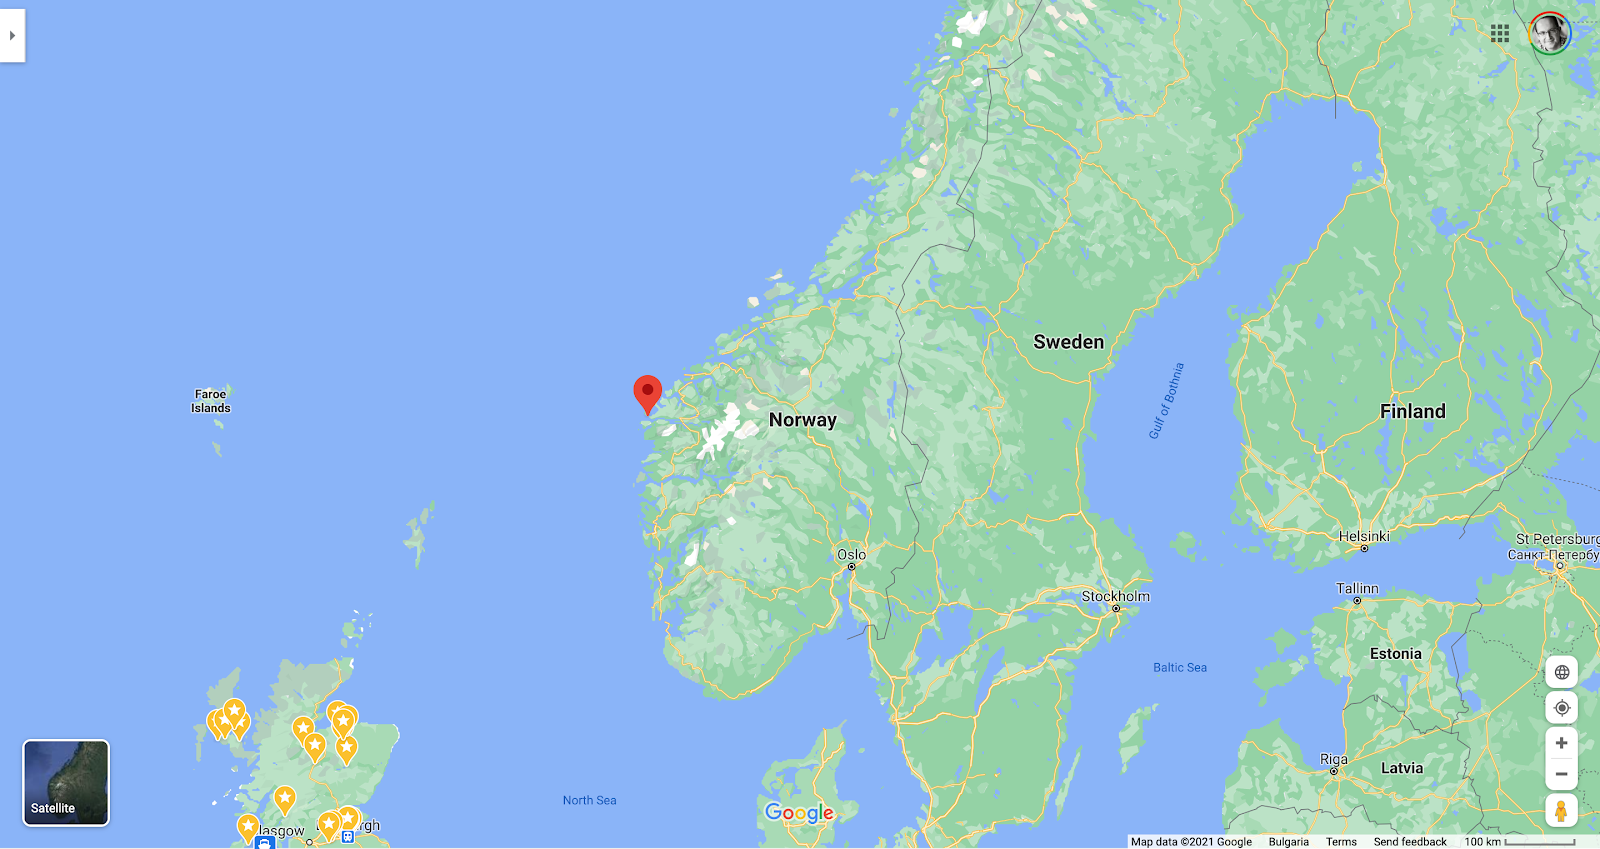
Whereby is a fully distributed team of around 100 people. Although they are remote-first, the company considers Måløy — a town of fewer than 4,000 inhabitants on the western coast of Norway — it’s home base.

Whereby was initially founded as appear.in and as a subsidiary of Telenor, one of Norway’s largest telecoms, before being acquired by Videonor AS, a video conferencing service provider based in Måløy. Remote work is part of the team’s DNA and Whereby lives and breathes its company mission.
We spoke to Ken Carlson, Whereby’s Director of Finance, to learn about how the company approaches growth and how they are using ChartMogul’s Subscription Analytics Platform to achieve that.
The Challenge: Improving the understanding of key growth metrics
Whereby is one of the companies that benefited from strong tailwinds from the massive switch to working from home due to the global pandemic. The company grew its user base by 450% in 2020.
However, even before that occurred, Whereby was experiencing healthy growth and they realized they needed to improve the understanding of key growth metrics.
We were growing at a steady pace and it was becoming increasingly important to get better insights into how our different subscription plans were performing.
Tweet this quote
Before they switched over to ChartMogul, the team was using another tool to analyze their revenue data and track their metrics, but they were becoming painfully aware that they needed additional features and insight if they were to get a deeper understanding of their growth engine.
The team was interested in having a higher level of control over their data and how some metrics are calculated. ChartMogul’s data editing tools and data settings provided the capabilities they were looking for.
That’s how the team decided to start looking for alternative tools. The process, which began in February 2020, was spearheaded by Whereby’s CEO Øyvind Reed with multiple members of the team taking part in the evaluation process.
Ken shared that from the beginning ChartMogul looked a lot more feature-full than what they were using at the time. In addition, they had some very positive interactions with the customer success and product teams, which helped them to quickly make the decision and move forward with ChartMogul.
The Solution: ChartMogul is the comprehensive tool for revenue analytics
Whereby has a fairly simple setup, using Stripe for all their billing. However, Ken believes that ChartMogul is an essential piece in their stack, adding vital insight.
We wouldn’t be able to have the kind of financial insight without your tool.
Tweet this quote
That is because Whereby is using ChartMogul not simply as a tool to track their key metrics, but also to gain deep insight they can act upon and drive specific initiatives based on that.
Whereby is currently using a freemium model where a large proportion of customers start on the free plan and convert to one of the paying plans later in their engagement with the brand.
Ken and his team are very focused on analyzing how these plans are performing and how many people are converting to the paid offerings of Whereby.
Naturally, they are tracking their leads and trial-to-paid ratios. ChartMogul is giving them the opportunity not just to track the core numbers, but also to segment their data to understand their customers better.
Other teams at Whereby are using ChartMogul’s Subscription Data Platform in similar ways. For example, the product team is gaining insight into whether they are building the right features for the right set of customers.
When we are working on a new feature, we start with a hypothesis of how it will create value for the customer. After some time, ChartMogul helps us by giving us better insights whether we’ve provided that value.
Tweet this quote
The Result: Improving the business model with deep insight
Whereby have already used the insight ChartMogul provides to optimize their pricing. The new pricing structure provides a way to start relationships through their free plan and then convert free users to paying customers.
Thanks to ChartMogul, they have a way to understand the long-term impact of their free plan. That gives them a much better view of how those customers affect the growth and profitability of their product.
ChartMogul is a tool that helps you to get a better understanding of the value you provide to customers.
Tweet this quote
Metrics as a spotlight
Ken and I were discussing how a North Star metric can help the team to align around long-term growth. I was asking him about some of the metrics Whereby tracks and that prompted him to share an interesting thought:
Metrics are like a spotlight: You look at the gross churn and it tells you how well you are doing retaining customers. Then, you switch over to net churn to analyze how aligned you are with the success of your audience. Both are important and give different insights into how successful you are with your customers.
This is the thinking that’s allowing Ken and the whole Whereby team to look beyond their core numbers and find new ways to improve their product and their business model.
