
Lavender is an AI sales email coach. They help revenue teams write better outbound emails that get more replies, with real-time scoring, personalization suggestions, and inbox-native coaching inside tools like Gmail and Outlook.
When Lavender began scaling two very different go-to-market motions, a self-serve PLG product alongside an enterprise sales-led motion, the team ran into a problem that’s surprisingly common for growing SaaS companies: they could no longer answer basic questions with confidence.
What was their ARR?
Revenue was flowing through Stripe, but the metrics underneath it were increasingly difficult to reconcile across products, pricing models, and customer types.
As Elliott Fisher, Lavender’s COO, put it:
“When I joined the company in 2024… there was never full confidence in what our ARR number was.”
How did they get here?
Over-architected RevOps
In Lavender’s case, the ARR confusion wasn’t the result of one broken system, but rather years of adhoc decisions, shifting ownership, and well-intentioned workarounds.
Scaling two different go-to-market motions means constant experimentation… trying out different messaging, growth tactics, and pricing strategies.
“We had consultants and we paid them a fortune. We hired a RevOps director… we had another SaaS tool for analysis and forecasting… All of this contributed to us over-architecting how we did RevOps.”
Once you’re selling to different customer types, through different workflows, with different billing paths behind the scenes revenue stops being a simple number. It becomes an ongoing coordination problem.
The moment Lavender had to “blow it up”
One day, the CEO asked a simple question: “What’s our current ARR number?”
And no one could answer with confidence.
“None of the leadership could give him an answer… and at that point it was like, alright, we have to essentially blow this up and rebuild it from scratch.”
For Elliott, it was a crucial moment. They needed to stop layering fixes on top of an already complex system. Instead of continuing to patch over inconsistencies, Lavender made the decision to start fresh.
They returned to the only source of data they still fully trusted: Stripe.
The team exported four years of invoice history and rebuilt their ARR waterfall model manually in Excel, line by line. It was a painstaking process, but it gave them something they hadn’t had before: a clean baseline.
More importantly, it forced Lavender to establish internal consistency around revenue definitions, inputs, and ownership, creating the foundation for stronger SOPs moving forward.
ChartMogul as the lifeboat and the source of truth
Once Lavender had rebuilt a clean baseline for their subscription data, the next step was making sure they never had to do it manually again.
Their CFO at Pilot advised them to automate ARR properly. That’s when Lavender turned to ChartMogul.
Lavender onboarded in less than a week.
“ChartMogul was so straightforward and intuitive… It was very relieving. Here we finally can have this number calculated for us in real time.”
Unlike the tools they had tried before, ChartMogul didn’t introduce more complexity. It gave Lavender a reliable ARR number immediately, with the option to grow into deeper analysis over time.
“ChartMogul could be as simple as telling us ARR, and as dynamic as analyzing revenue by product or customer type as we grew”
Cleaning up what automation usually can’t
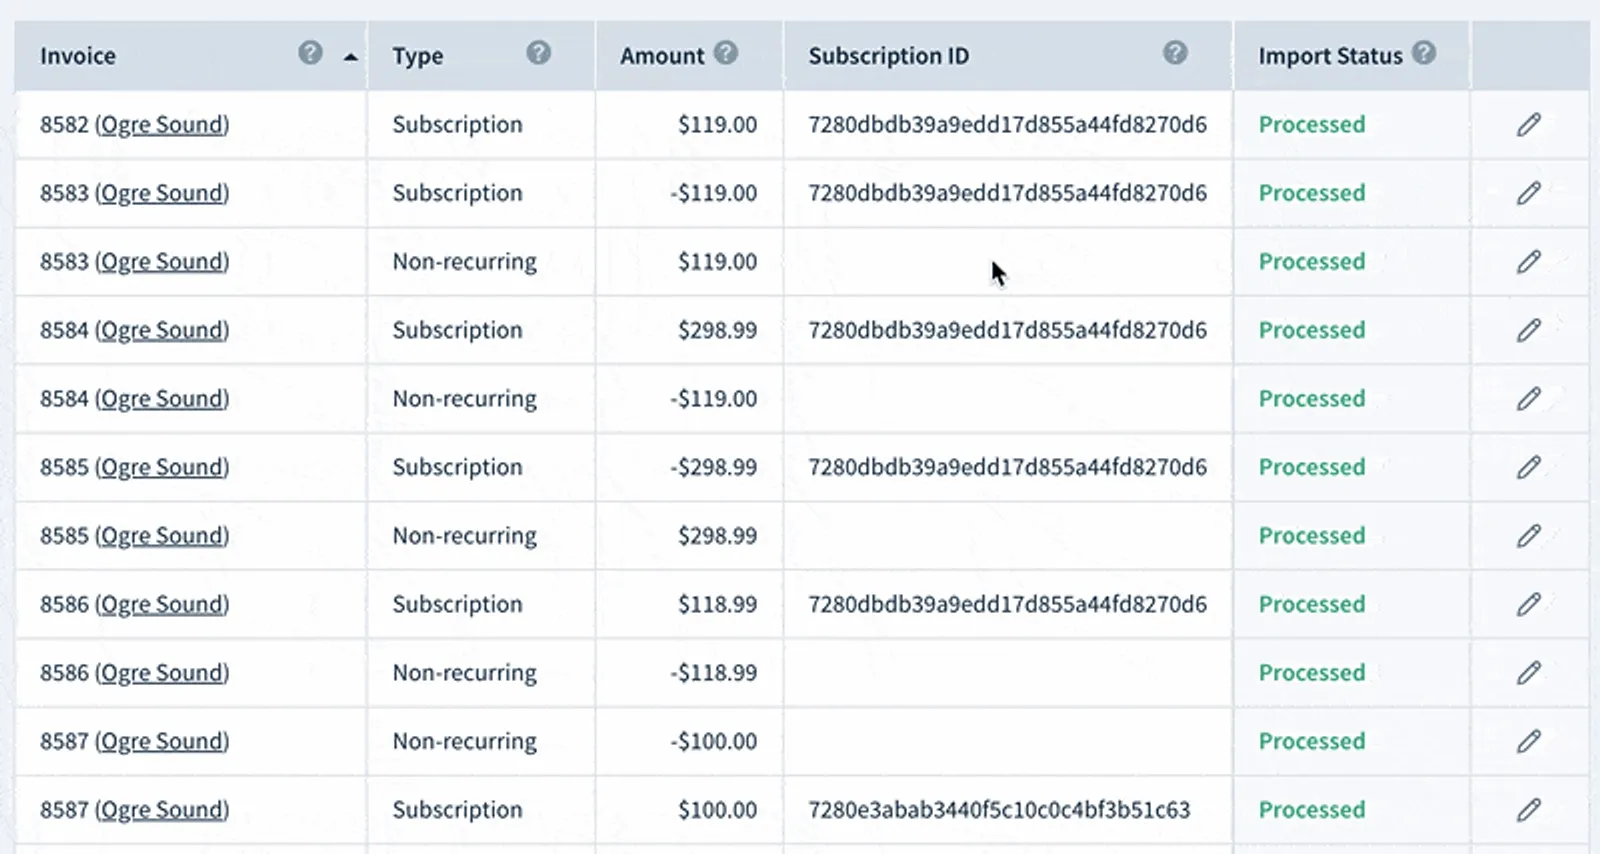
What made Lavender’s setup especially complex was that their subscription data didn’t live in one place. They had multiple Stripe accounts supporting their self-serve motion, plus SalesBricks for enterprise deals. In many cases, a single customer showed up across all three systems. An enterprise customer might exist as a contract in SalesBricks, have a one-time payment in one Stripe account, and a recurring subscription created in another.
Before ChartMogul, reconciling that kind of sprawl meant spreadsheets, workarounds, or simply accepting that the numbers would never fully line up. With ChartMogul, the team could edit invoice data directly, merge multiple records into a single customer, manually generate subscriptions where they didn’t exist, and change one-time payments into subscription revenue when needed.
That flexibility turned out to be critical. Instead of forcing Lavender to rebuild their processes around a rigid data model, ChartMogul allowed them to reflect how revenue actually flowed through the business, and then standardize it going forward.
Running the business on ChartMogul
Today, Elliott considers ChartMogul Lavender’s metric foundation.
“ChartMogul is our source of truth… because it aggregates the information across products.”
Elliott uses it daily, from leadership reporting to renewal visibility. Weekly exec meetings run on churn, retention, renewals, and ARR. New subscriptions are verified in real time, and upcoming renewals are proactively flagged to the sales team.
As Lavender expanded its product offering, ChartMogul also helped the team understand where growth was coming from and who was driving it. With enrichment and segmentation, Lavender could analyze cohorts by:
- Industry
- Company size
- Geography
- Customer segment
“Jordan said, ‘we can actually do data enrichment for you.’ Another life-saving miracle for us.”
The result was clearer cohort analysis, sharper go-to-market decisions, and more confident reporting across the business.
Elliott’s advice: simplify first, automate second
For Elliott, the lesson is simple and hard-earned. Clean metrics don’t come from complex tooling. They come from consistent workflows, clear ownership, and operational rigor.
“You need to simplify the workflow. Create a process where the data can be consistent. Assign an owner… then look for tools like ChartMogul to automate the work.”
In the end, the goal wasn’t more software. It was clarity, consistency, and a system the business could trust.