
Buffer 是什么
Buffer 成立于 2010 年,几乎不需要介绍。作为 SaaS 领域的早期玩家,这家公司开创了如今在业内早已稀松平常的好几件事——内容营销、透明创业运动,以及远程工作。

Buffer 的使命,是让客户有能力在社交媒体上建立品牌、经营自己的受众。
为此,他们为客户提供 3 款产品:
- Publish:最早的那款产品,帮人们在社交渠道上排期和发布内容
- Reply:共享收件箱,用来回复社交渠道上的对话
- Analyze:面向社交媒体的分析与报表
我们和 Buffer CEO Joel Gascoigne 聊了聊他打造 Buffer 的经历,以及订阅数据在这家公司里扮演的角色和位置。
挑战:Buffer 正在累积“报表债”
Buffer 成立后的头两三年,Joel 和团队并不需要专门的订阅分析方案。
那时交易量还很小,靠数据库查询就能算出 MRR、流失,甚至还能做一些同期群分析。
但随着公司变大,这套系统开始动不动就出问题,逼着团队重新审视做法,去找一个能扩展的方案。
2014 年,Buffer 同时用上了 Baremetrics 和 Looker。Baremetrics 满足了对外公开透明的诉求,而在内部,团队几乎完全靠 Looker 来跟踪和汇报收入指标。
Baremetrics 的局限在于只能分析来自 Stripe 的收入,而团队当时已经在用移动端和自定义开票来计费收款了。
所以他们决定用 Looker 来满足内部分析需求。它确实帮他们跨过了最初的一些难关,但时间一长,又生出了别的麻烦。
除了要专门配一个 2 人小组来维护这套自建方案,他们在 Looker 里收集数据、并信任这些数据,也很吃力。
It felt like a constant battle to get all the data in and it was also costing us a lot of time. I would often message (Buffer data scientist) Julian to ask “Why did our MRR number for this or that change?”
Joel 承认,他和团队大概花了太长时间才意识到,分析体系必须换了。
Early in 2019, I had an epiphany moment. I realized we had better data in the first 2-3 years of the company when we were using improvised solutions, than with our sophisticated business intelligence platform. How was that possible?
不可靠的数据拖慢了整个团队
就在这时,Joel 意识到这些问题影响的是整个团队——包括产品的演进方向。
We increasingly started to feel like we were running blind. Because of the challenges we were struggling with, we constantly had to rely on assumptions for important decisions about the product and it was starting to tell.
这一切多少有点出人意料,毕竟 Buffer 团队其实淹没在数据里——Joel 告诉我们,把付费客户、免费套餐和 14 天试用加在一起,他们当时的月活跃用户(MAU)大约有 35 万。
但这并没有让业务的进展变得更清楚。
MRR numbers were changing all the time. I realized we had a moving target for the most important metric in our company.
这套体系正在影响团队文化
最初,Joel 和团队希望用上 Looker 之后,大家都能借订阅数据获得洞察、为业务做出更好的决策。
但事实并非如此,整个组织反而变成了处处都要找数据团队帮忙。
At some point, I noticed this was producing a change in our team culture. More and more people just started to assume that they “were not good at data”.
解决方案:投资一套彻底翻新的数据基础设施
Joel 告诉我们,他们之所以拖了这么久才决定弃用 Looker,一部分原因是团队舍不得放弃一套自己花了那么多时间搭起来的方案。
In hindsight, I think that waiting 4-5 years, when things were clearly not working out, was too long. In the end, I had to step in and make a call for the best of the (whole) team.
他们当初搭这套体系的时候,分析这个细分市场还不成熟,所以只能靠自己。而这一次,Joel 意识到自己需要退后一步,换上一种“零预算”的心态。
I asked myself “If we were starting today, what would we put in place?” So we started researching and we saw that while our peer companies were using a mix of homegrown and specialized tools, many new startups were adopting the likes of Segment, Mixpanel, and ChartMogul from the get-go. I wanted to be using the tools of the future and always ready to upgrade and switch things out, rather than getting behind and building up debt. That would make us less effective, and also less attractive to people joining the team.
Joel 和 Buffer 的 CTO Dan 进行了一次他称之为“坦诚对话”的交流。在那次会上,他们决定彻底重构分析体系。
Joel 分享的一个有意思的点是:他清楚引入这些软件工具需要一笔不小的投入,但他是有意识地做了这个决定:
I would gladly spend $100,000 on a tool if that would allow me to avoid hiring. A smaller team allows us to be more productive and move quicker.
每一块都单独挑最好的
Joel 也明白,数据管道管理、产品互动分析和订阅分析分别用不同的工具,能让他们为体系中的每一块都挑到最合适的那一个。
Buffer 团队选了 Segment 作为数据体系的基座。它负责采集数据,再把数据喂给他们在用的其他工具。
Mixpanel “长”在 Segment 之上,帮团队跟踪用户与产品的互动。
ChartMogul 把来自 Stripe、移动端和自定义开票的订阅数据汇到一处,让 Joel 和团队看清业务的走向。
这套体系也让系统的扩展变得轻松,并且很容易和 Buffer 团队在客服(Zendesk)、应用内消息(Appcues)以及邮件(Customer.io)上使用的工具打通。
自己造?
有一段时间,Joel 认为最好的办法是自己造一个工具来跟踪收入和其他关键订阅指标。
但他意识到,这不只需要投入工程资源,还得回答一些并非他们长处所在的难题。
“我们该用哪个 MRR 公式?”这类问题让 Joel 明白,他们应该专注于为客户创造价值,把自己不在行的领域“外包”出去。
结果:靠更好地理解数据重新点燃增长
凭着分析和使用数据的新方式,Buffer 团队已经推动了业务上的战略性调整。
2018 年初,MRR 增长开始放缓,这促使 Joel 开始琢磨:从当时 1600 万美元的 ARR 一路做到 5000 万美元,最好的路径是什么。
他知道,指望下一轮 10 倍的收入增长靠再加 70 万客户(大约是当时客户数的 10 倍)来实现,是不现实的。
他这才意识到,必须找到一条新的增长路径。而看自己的订阅数据,让他们找到了前路。
于是团队决定,把重心放在快速拉升 ARPA 上。
Joel 说,当时的每账户平均收入(ARPA)只有 18-19 美元。团队定下目标要把这个数字做上去,好让公司重新回到增长,并有余力投入产品开发。
为了提升 ARPA,他们选了两个明确的战略方向:
- 他们重新检视了定价和套餐组合,并做了调整,让自己能以更有意义的方式支持客户。比如最低档套餐从每月 10 美元涨到 15 美元。
- 他们扩充了产品线,在社交媒体管理工具套件中加入了 Reply 和 Analyze。
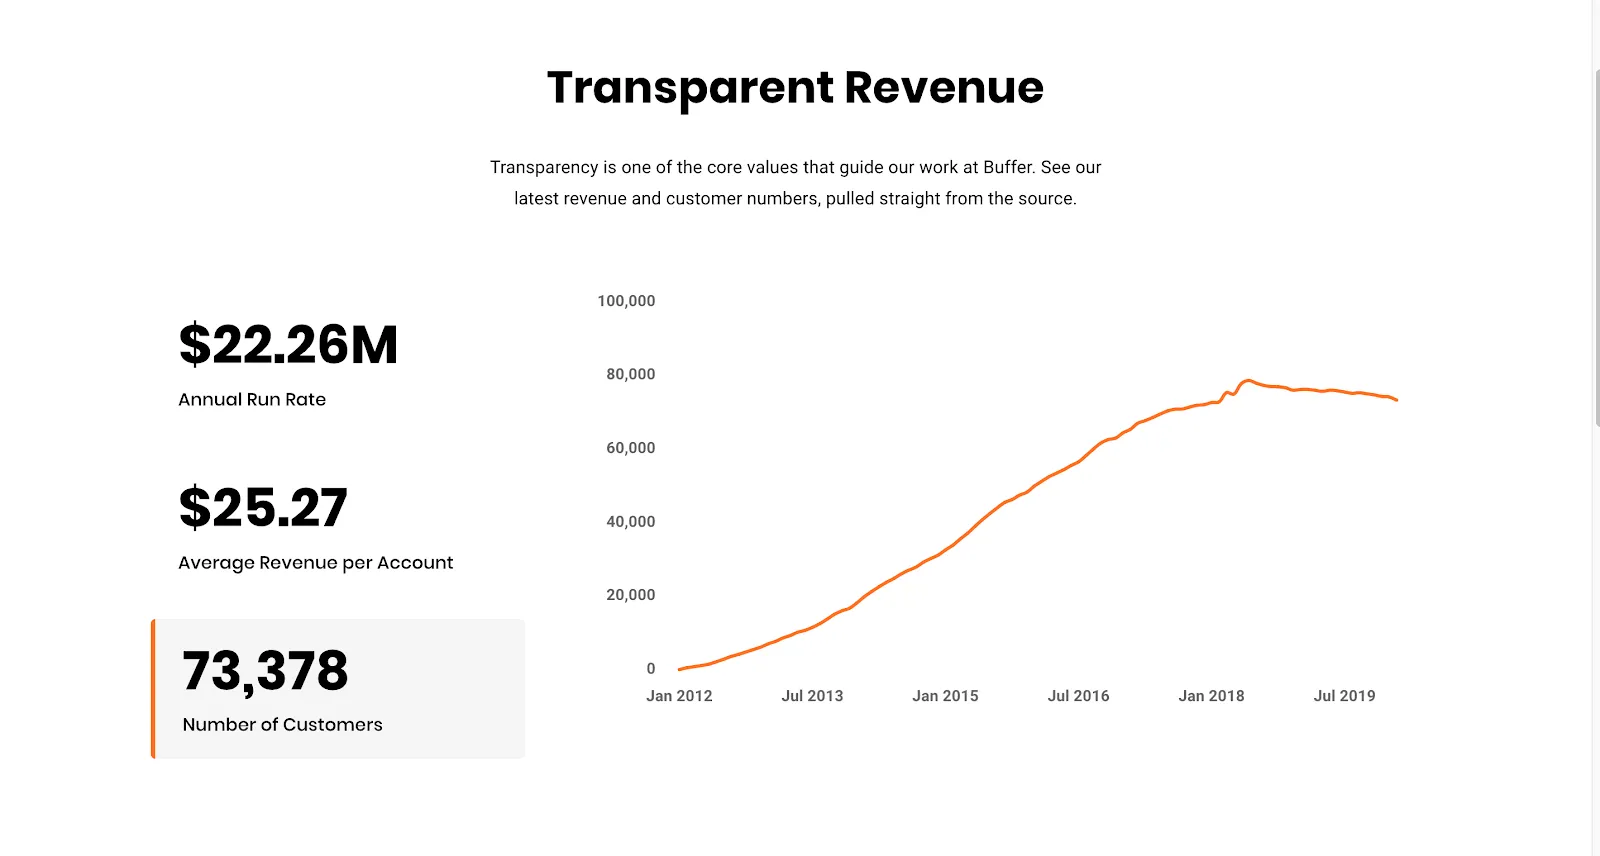
今天,Buffer 的每客户平均收入约为 25 美元。
付费客户数基本持平在 7.5 万左右,但这项举措让团队维持住了增长,并把 ARR 做到2000 万美元。

两个不同的北极星指标?
我们最初问 Buffer 团队他们的北极星指标是什么时,产品团队的人提到了 ARPA。
Joel 也看 ARPA,但他会把它放在 Buffer 总体 MRR 的语境里来思考。
I see ARPA as one of the components of MRR (ARPA * Customers = MRR). Within that formula, we consciously decided to ignore the "Customers" variable and focus entirely on the ARPA variable, to drive MRR. So the team was focused on that, which is great, and of course, I'm always looking at MRR. At the end of the day, that's our revenue and drives a lot of other strategic decisions such as hiring and other spend.
不过他也承认,MRR 也许不是审视业务最有意义的角度。
Telling product managers to “grow MRR” is not actionable. Improving our analytics set up allowed us to identify a solid strategy to implement.
ChartMogul 在这件事上功不可没。Joel 告诉我们,他浏览器里常开着 3 个标签页——一个是日历,一个是他们用的内部团队沟通工具,最后一个是他们的 ChartMogul 仪表盘。
不想被甩下,就用好你的订阅数据
在 SaaS 行业经营的这十年里,Joel 看到这个行业变得越来越成熟老练。
他相信这个特征会一直延续下去,并对行业产生更强的影响。
他把订阅数据称作 SaaS 企业的“主心骨”——因为它是唯一真正能说明什么有效、什么无效的洞察来源。
It is going to become a competitive advantage to have a deeper knowledge of your subscription data.
Joel 认为,那些没有养成理解并有效使用这些数据的文化的公司,注定会被甩在后面。
We’re at the point where if you’re starting a SaaS company, you need a tool like ChartMogul from Day 1.