
2015 at a glance
January
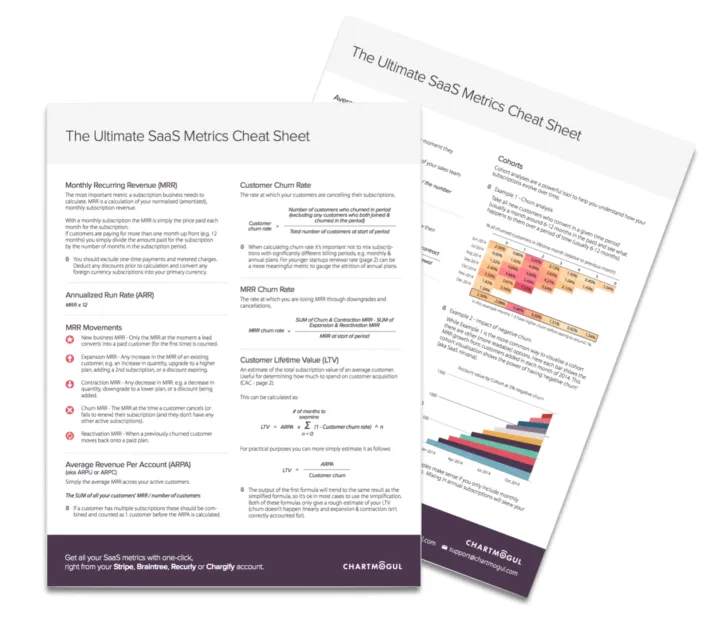
On January 6th we published The Ultimate SaaS Metrics Cheat Sheet - this turned out to be so popular that we've started mailing printed copies out to new customers.
January 6th was also the day we had our first customer start paying for ChartMogul. Also in January we announced our seed funding from Point Nine Capital and others.
Announcing our investment in @ChartMogul. CC @Nick_Franklin and @MichaelFHansen http://t.co/TfNQErSRv7 pic.twitter.com/tSwrrykm9E — Christoph Janz (@chrija)January 15, 2015
February

February 5th was the inaugural SaaStr Annual. 2015 was the year that SaaS went truly mainstream and Jason Lemkin emerged as it’s godfather. We were blown away by the scale and potential for a community surrounding the SaaS space. SaaStr Annual 2016 looks to continue this momentum and take things to another level - and of course, ChartMogul will be there! During February we also launched a major new feature: Cohorts. Cohort analyses are key for any SaaS business to drill down into their revenue churn and identify trends that help to target a solution.
Announcing Cohorts - Get cohort analysis for your SaaS / Subscription business with one-click https://t.co/aU8EPVXLaC pic.twitter.com/V3xkh0GAsS — ChartMogul (@ChartMogul) February 16, 2015
March
March saw us release our Chargify integration, which meant that Chargify customers could connect their account and quickly get access to our awesome metrics and analytics for their account.
I also weighed in on the State of play for Berlin's B2B SaaS startups:
New blog post: State of play: Berlin B2B SaaS Industry https://t.co/hwhpcUVYHJ pic.twitter.com/vHc1T9Dt74 — ChartMogul (@ChartMogul)March 17, 2015
April
In April we launched our Manual Customers feature. Most people have customers that they bill manually, outside of their billing system (i.e. invoices) and this feature allowed everyone to import these customers and include their data in ChartMogul's metrics. We also added support for multiple data connections.
May to July
On our blog, we kicked off May with a huge analysis of B2B SaaS pricing pages:
5 key learnings from analyzing top B2B SaaS pricing pages http://t.co/EqUE6dvknp ft. @contentful @shopify @hubspot pic.twitter.com/WBYD4VivBJ — ChartMogul (@ChartMogul)May 5, 2015
In June we extended the functionality of our Manual Customers feature, allowing for upgrades, downgrades and deletions. We released our Metrics API in July, paving the way for people to build apps and integrations on top of the ChartMogul platform:
We're excited to be announcing the ChartMogul Metrics API https://t.co/axhQTzYaLV pic.twitter.com/lvv597JeW7 — ChartMogul (@ChartMogul) July 20, 2015
August
We launched a complete redesign of ChartMogul, paving the way for future new features as we build out the platform. TheNextWeb were even kind enough to write about it.
On August 26 we announced our second round of seed funding:
Announcing our Second Seed Investment https://t.co/fwXEPZn3Re pic.twitter.com/JZXCHYoz7t — ChartMogul (@ChartMogul)August 26, 2015
We also built a Zendesk app, using the recently-released Metrics API.
September and October

In September we finally got our own home in form of a 200sqm office in Berlin's Mitte district, and by October our team had grown to fifteen!

On October 5th we launched our PayPal integration.
We also welcomed our 500th paying customer at the start of October and launched a new Customers page to celebrate.
Looking ahead: What to expect from ChartMogul in 2016
While we’re keeping a few things close to our chest you can expect to see a slew of new features going live in the first couple of months of 2016, with more tools to help you measure, understand and grow your recurring revenue.
We'll also be at SaaStr Annual again in February (this time with a booth)...so we're looking forward to seeing some of our customers there again.
The whole team at ChartMogul would like to wish Happy Holidays and a prosperous 2016 to all our customers, partners and friends, thanks for making 2015 so great!