
Cohort analysis isthe best way to understand how the behavior of your subscribers evolves over time. ChartMogul Cohorts brings you powerful cohort analysis at the touch of a button - removing the previous headaches associated with spending hours in Excel.
What is a cohort?
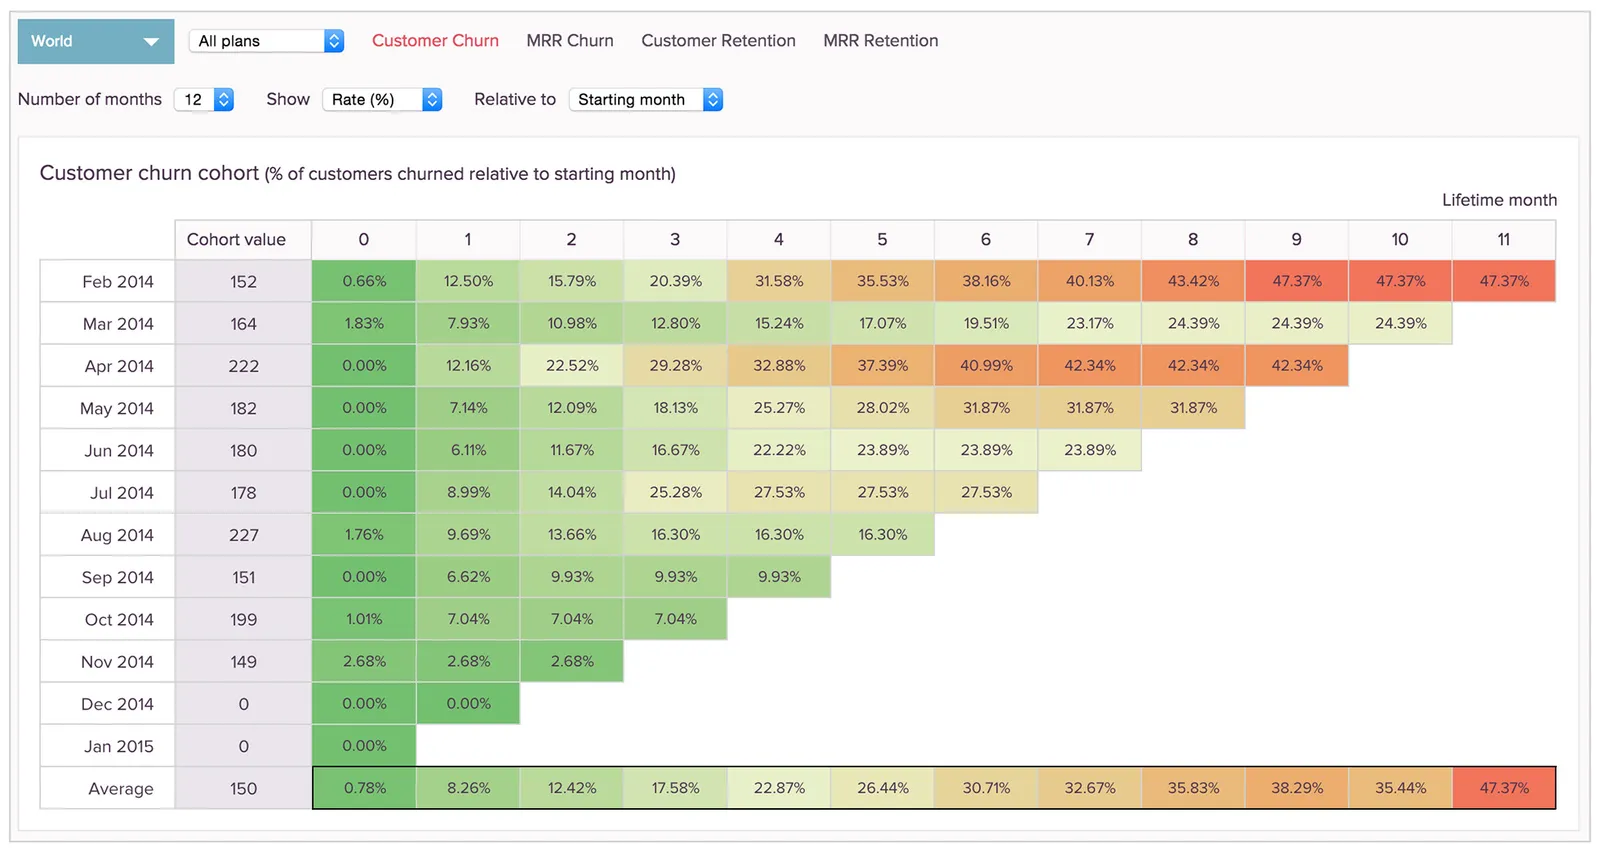
In SaaS, we use cohort analysis to observe what happens to a group of customers that joined in a particular time period. So we have a January 2015 cohort, a February 2015 cohort, etc. We then visualise how our various cohorts (groups) behave over time.
Why are they so useful?
A cohort analysis let’s you see a more complete picture of how your subscriptions evolve over their lifetime.
Instead of looking at aggregate numbers like churn rate, a cohort analysis visualises the way your churn rate evolves over the lifetime of a group (cohort) of customers who converted in the same time period (usually a specific month).
This allows you to find answers to questions like:
- At which point in the lifespan of a subscription is churn at it’s highest?
- Does churn stabilise after some period of time?
Cohorts is available immediately to all customers on our PRO plan.
Find out more about ChartMogul Cohorts
How to read a Cohort Analysis
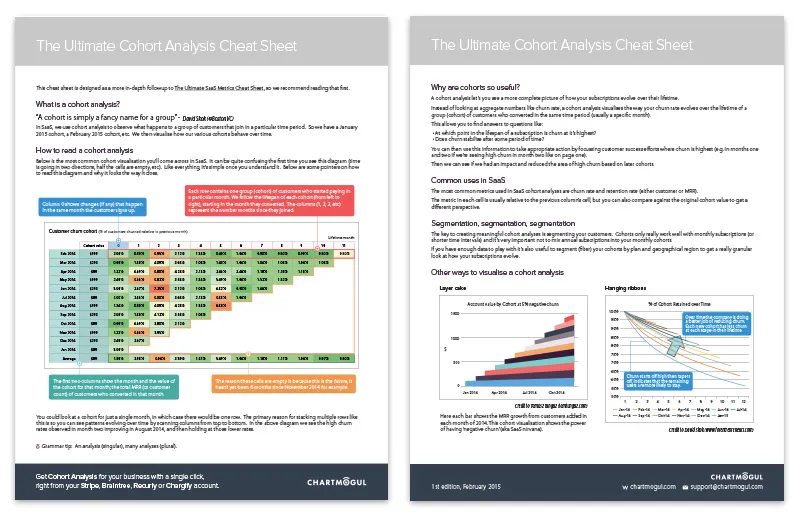
Master Cohorts with The Ultimate Cohort Analysis Cheat Sheet