
If you’re evaluating Baremetrics versus ChartMogul there are a few things that you should consider.
- Power and flexibility. ChartMogul has more powerful analytics and segmentation functionality. You have access to more charts, more cohorts, and ultimately more information about your business from which to derive insights. With ChartMogul you can quickly build segments to apply across all of your charts, helping you discover which pricing plans are most profitable, which customer profiles are likely to convert, and who your great-fit customers really are. We also offer more direct integrations with billing systems, enrichment data sources, and export destinations.
- Control and transparency. ChartMogul offers data settings that give you full control over how your metrics are calculated. You can see how individual MRR movements track from your billing system to your metrics in ChartMogul, directly within our UI. Data editing tools make it possible to attain perfect accuracy from your billing data, and consequently, your subscription analytics.
- Pricing. ChartMogul is offering all of those features at a lower price. Since Baremetrics announced its most recent price hike, effective April 2022, ChartMogul has a more comprehensive feature set and it makes more financial sense.

Grow your recurring revenue with ChartMogul
Growing a subscription business is hard work. You have to track MRR, churn, LTV, cash flow, and more in order to focus your efforts and make the right decisions for your company. But to succeed in SaaS, you need to understand the trends driving those top level numbers – the micro metrics behind the macro.
You need to understand not just what your churn rate is, but which groups of customers are churning, at what point in their lifecycle, and why. You need to understand which segments of your market are driving the most growth and which plans contribute most to your MRR. The list goes on.
There’s a world of difference between the features of a subscription metrics tool, and the functionality that comprises a subscription analytics platform. Both can calculate MRR, churn, and ARPA – but only one can act as a hub of revenue data. One solution can ingest data from multiple sources to act as a single source of truth, while having the capability to enrich that data from any source, and send that data to your favorite SaaS tools or your data warehouse for further analysis.
ChartMogul grows with your business, because the problems that you face at $10k MRR are not the problems you face at $83,334 MRR and beyond.
Here’s how ChartMogul and Baremetrics face off feature-wise:
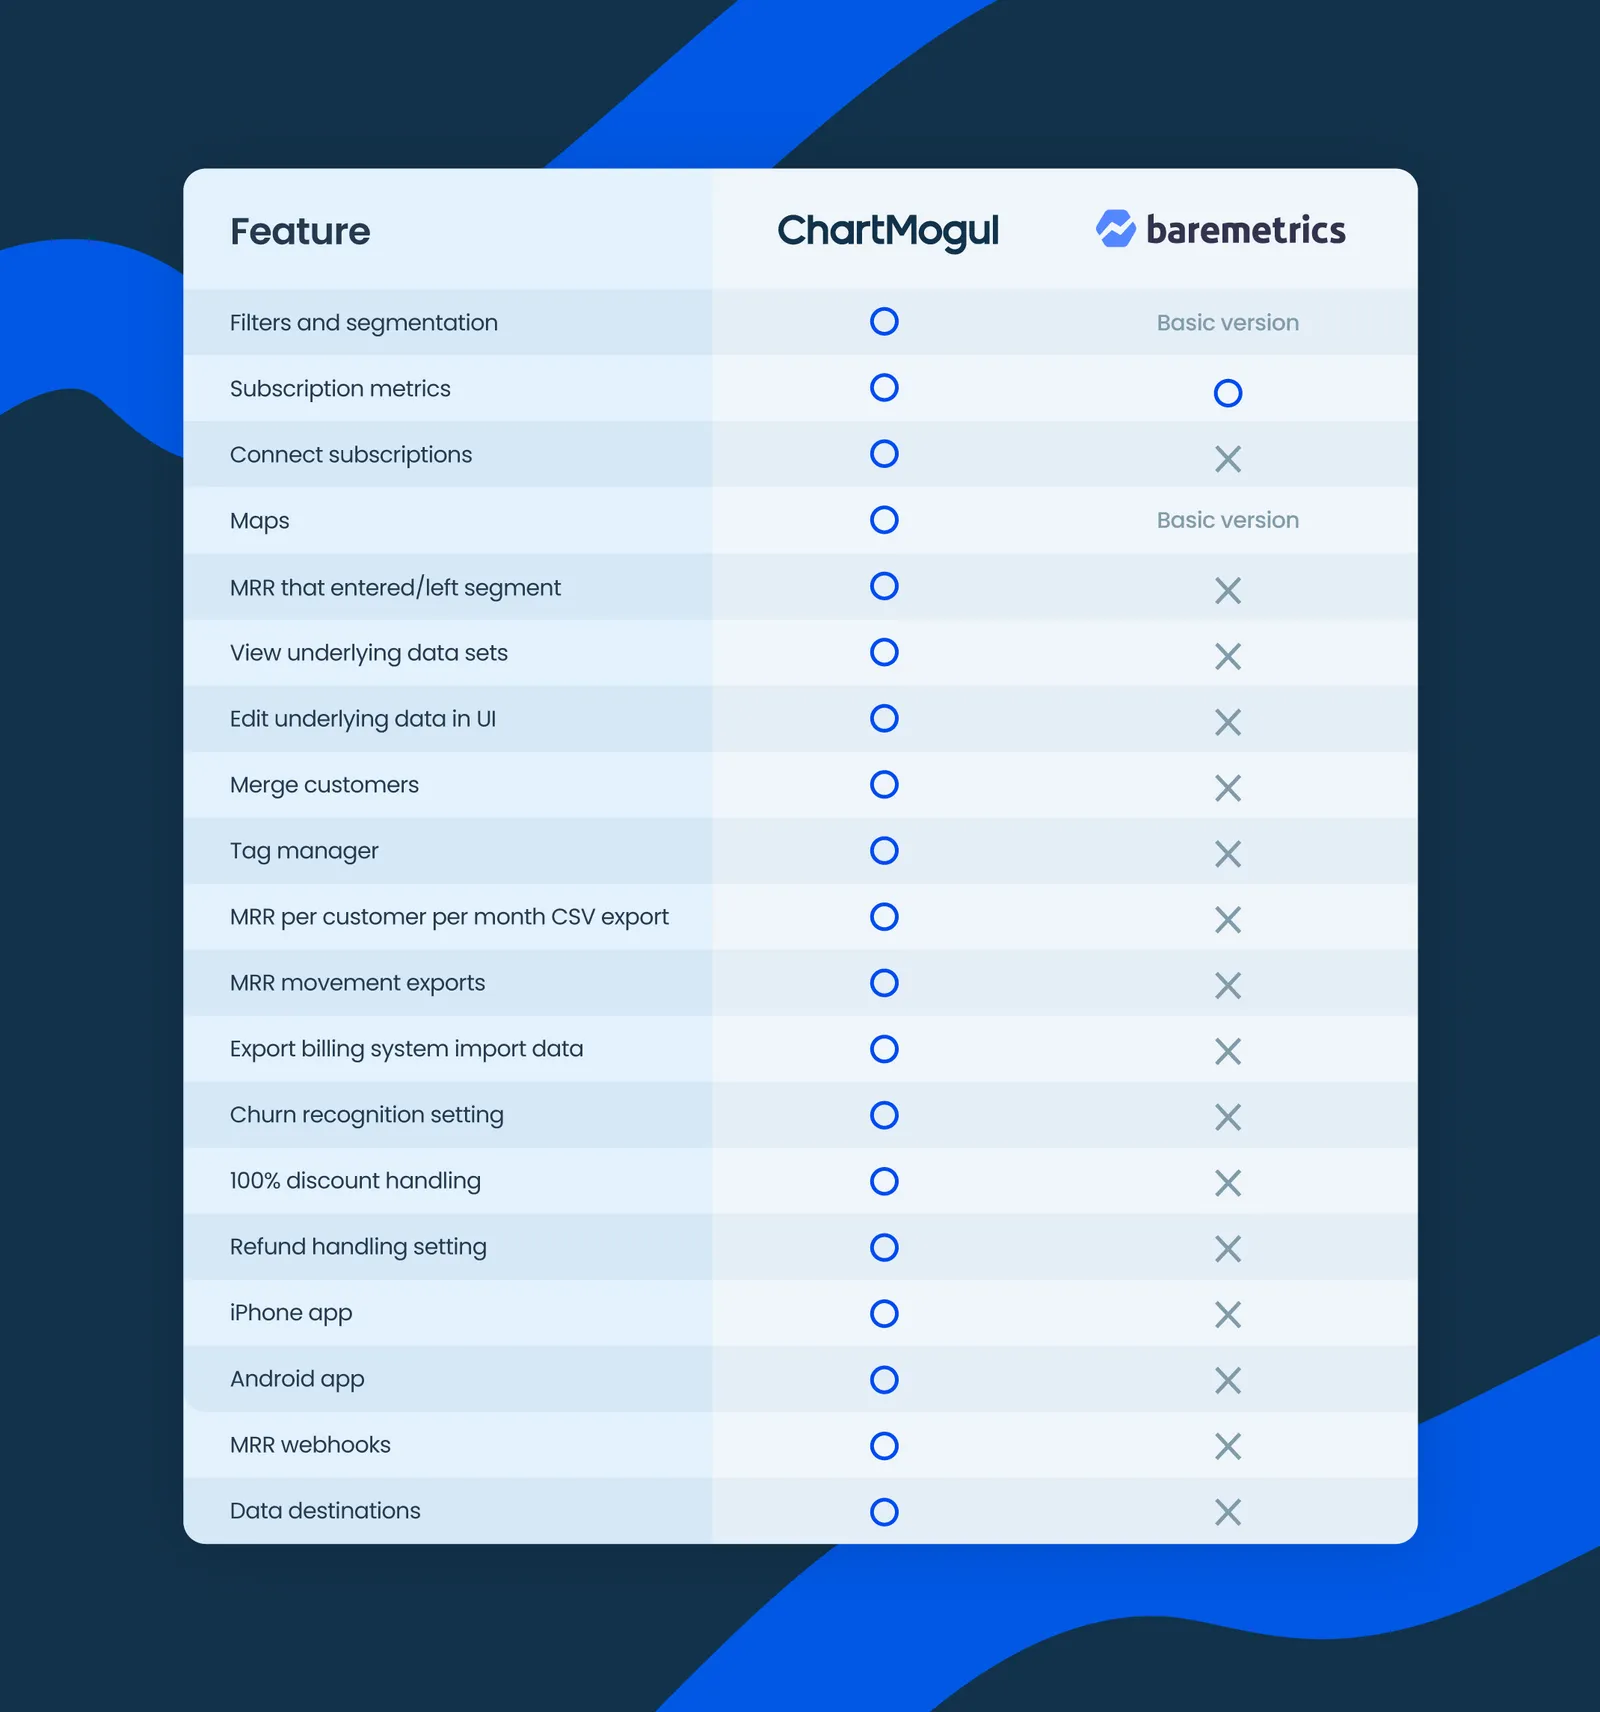
Segmentation and analytics
Compared side-by-side with Baremetrics, ChartMogul provides you with more charts, cohorts, and other features with which you can use to optimize your business and strategize for future growth. Easily check MRR movements – new business, upgrades, downgrades, churn, and reactivations – and see how they contribute to your overall MRR growth.
Customer churn (or retention) cohorts allow you to see how subscriptions perform over time, relative to the starting month or the previous month. Heat maps aggregate your invoice data and overlay it on a world map so you can see your ARPA, churn rate, or LTV by region. You can also customize each chart and create beautiful visualizations. When you create a chart that you love you can save it for yourself, or add it to the dashboard for the whole team to view.
ChartMogul provides you with an infinite number of ways to segment your customers - beyond what’s in your invoice data (though we offer many filters out of the box). With our Enrichment API (or Zapier) you can pipe information from your CRM, marketing attribution data, or data from any other source, and get the full picture of your business. Then you can use these custom attributes to determine which groups of customers have the highest ARPA, LTV, retention rates, and more.
Any of the filters or segments you add will be applied across all of your charts – and you can add as many as you like. Compare all your segments at once or toggle between them individually. There’s also no need to recreate charts, you can easily save them for yourself or share them with your team. Every chart you see in ChartMogul is actionable – it’s possible to drill down to the customer level and see the data that underlies the metrics in your analyses. Not only is ChartMogul a powerful tool, it also provides you with a great user experience.
Data import
ChartMogul offers direct integrations to Stripe, Chargebee, Recurly, Google Play, App Store Connect and many more. It’s also possible to build something custom with our API, or you could work with our partner SaaSync, to design, build, and maintain your integrations. If you like you can add data manually or use our Google sheets app. We have extensive documentation and are happy to lend a hand if you need help getting set up
Data auditing, editing, and advanced settings
We know that no two subscription businesses are alike – all have different needs for reporting and, more specifically, how metrics are calculated. For this reason, we provide numerous data settings that give you full control over how churn is calculated, when churn is reported, how refunds are handled, and how free customers are handled. ChartMogul and Baremetrics have one data setting in common; auto-churning delinquent customers after a given time period.
ChartMogul allows you to audit the data coming from your connected billing system. Our UI gives you full transparency into how every individual MRR movement was generated. Whenever you see some new business or an upgrade in your Stripe account, you can check out the ChartMogul data platform to see exactly how that MRR movement has mapped to our data model and rolls up into your metrics.
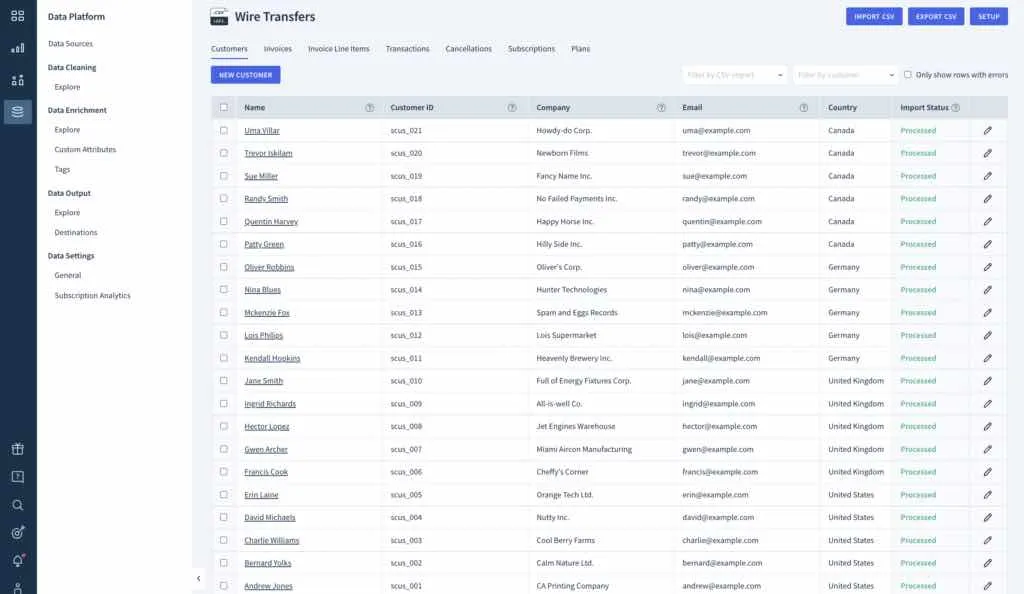
See all transactions in our Data Platform
Data output and integrations
With ChartMogul, you can add multiple data sources, and even send your subscription data elsewhere. We offer direct integrations with Amazon S3, Azure Blob, Google Storage for cloud services. Customers often send their data to a data warehouse; in this sense ChartMogul can act as an emitter of clean and tidy revenue data for you to perform even more complex analyses.
You can also connect ChartMogul to your favorite SaaS tools like Zendesk, Pitch, Geckoboard, and more. Baremetrics has a native integration with Slack. ChartMogul, by contrast, can connect to Slack via Zapier.
Beyond analytics
ChartMogul has dramatically improved the security of our APIs and provided increased flexibility for you and your team in the form of our new API access manager. Admins can create both read-write or read-only keys, and team members can create their own read-only keys.
You can get an overview of the health of your business with our iOS and Android apps. You can see Monthly Recurring Revenue, Annual Run Rate, and your total number of subscribers. It’s not just for admins either, team members can also download the app, track progress, and share in the wins.
So many of our customers are building their products and their audiences in public, so we also just added a way to download any chart and add a cool background for social sharing.
https://twitter.com/agazdecki/status/1488884410841583616
Baremetrics offers an email dunning tool called Recover. B2B churn is on average around 5% according to recent data from Recurly. If you break down this 5% further, voluntary churn accounts for 4.21%. While passive churn due to outdated credit cards is clearly a problem (even more so if you’re B2C with a higher volume of customers), it’s not a bigger problem than customers actively choosing to suspend service with your company.
ChartMogul’s strategic goal is to provide a holistic tool that’ll help you make data-informed decisions, discover your best fit customers, and grow your recurring revenue in a sustainable way – rather than charging for extras that’ll save you some customers who aren’t a fit and will probably keep churning anyway.
To sum it all up
Our customers love us because of the power and flexibility of our core product, the fast evolution of the data platform, and our dedicated (and growing) support, integrations, product, and engineering teams. Not to mention the ease of setup – if you’re thinking about switching to ChartMogul, we can easily import all your historical subscription data and get you set up in no time.
But don’t take my word for it, check out what everyone’s been saying…
We're at the point where if you're starting a SaaS business, you need a tool like ChartMogul from day 1 — Buffer CEO Joel Gascoigne
ChartMogul is absolutely worth the cost we've invested five times to ten times over — Instapage CEO Tyson Quick
ChartMogul is a tool that helps you get a better understanding of the value you provide to customers — Whereby Director of Finance Ken Carlson
Including custom data and tags enables me to put our growth metrics into perspective. We’ve been able find valuable insights that will drive not only our product decisions, but also our go-to-market strategy. My favorite features are the cohort analysis and MRR movements — Livestorm CEO Gilles Bertaux