
Since launching our Segmentation and Customer Attributes features back in January we’ve received a lot of positive responses. These tools have enabled ChartMogul users to create and compare customer groups in awesome new ways and dig much deeper into their subscription metrics.
The biggest feedback so far:
It would be amazing if we could add customer attributes without the need for a developer!
With this in mind, we’ve created a really easy way for you to add attributes to your customers, with zero code. Using our new Google Sheets app, non-technical members of your team can add attributes to your customers. The app allows you to send attributes directly from a Google spreadsheet, without calling in IT Support.
Recap: Customer Attributes
A customer ‘attribute’ is a data point containing some meta information about one of your customers, e.g. sales rep, NPS score - virtually anything you can think of.
Importing these customer attributes into ChartMogul allows you to create and compare segments of customers. This lets you answer complex questions such as:
- Which marketing funnel brings in the most MRR?
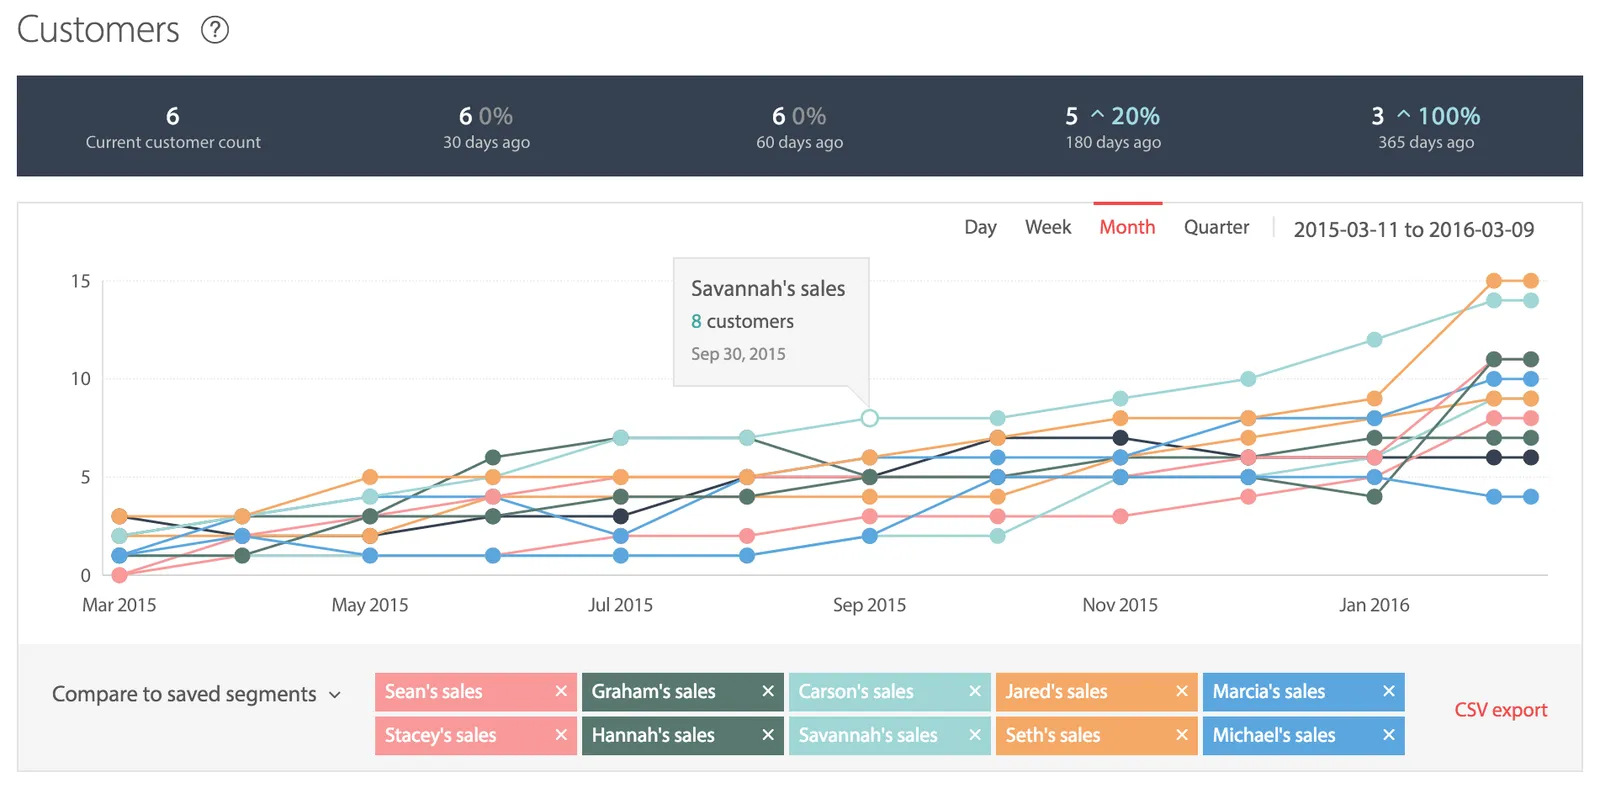
- Who are highest performing sales reps?
- Are NPS Promoters less likely to churn than Detractors?
- What are our highest performing verticals?
- Do users of a specific feature have a higher LTV?
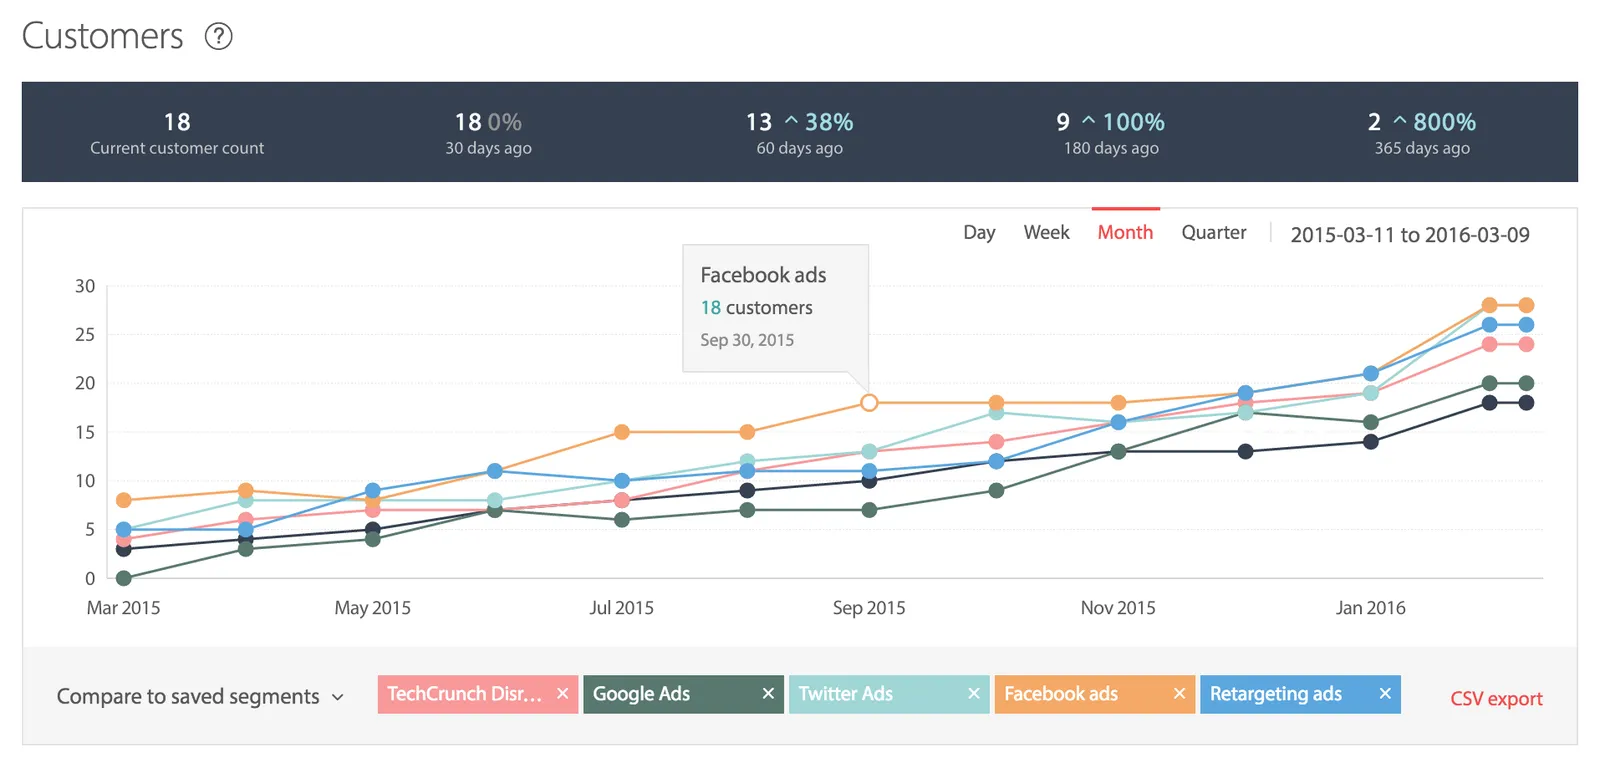
My favourite use case for Segmentation? Comparing the MRR generated by different advertising channels:
What does the Google Sheets app do?
- The app adds attributes to customer profiles.
- You can use these attributes to create filters.
- These customer attribute filters will be applied to your graphs.
- You can also save these filters as segments and compare them.
Examples
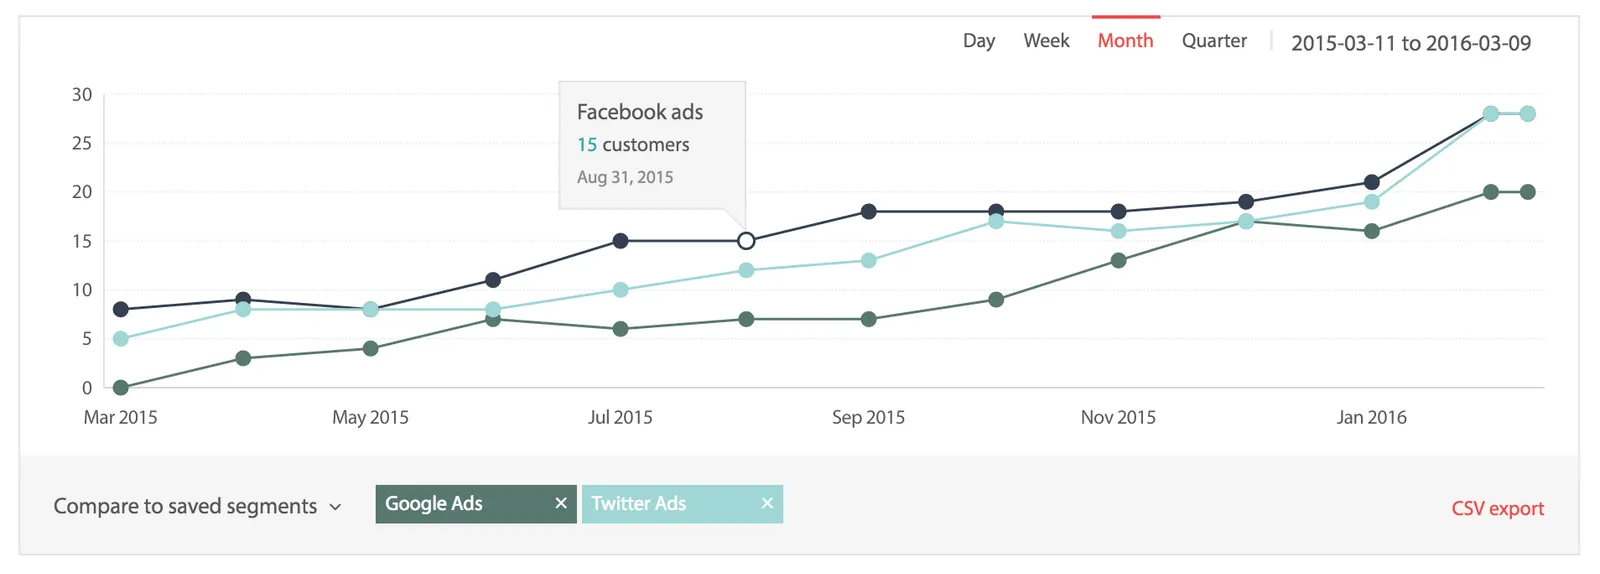
You can use the Google sheets app to compare the success rate of advertising campaigns to see how they are growing your customer base, or to see how NPS scores affect your churn rates, or compare user behaviour attributes to see which features generate the most revenue.
- Use a filter to create a new segment.
- Then compare multiple segments on your graphs.
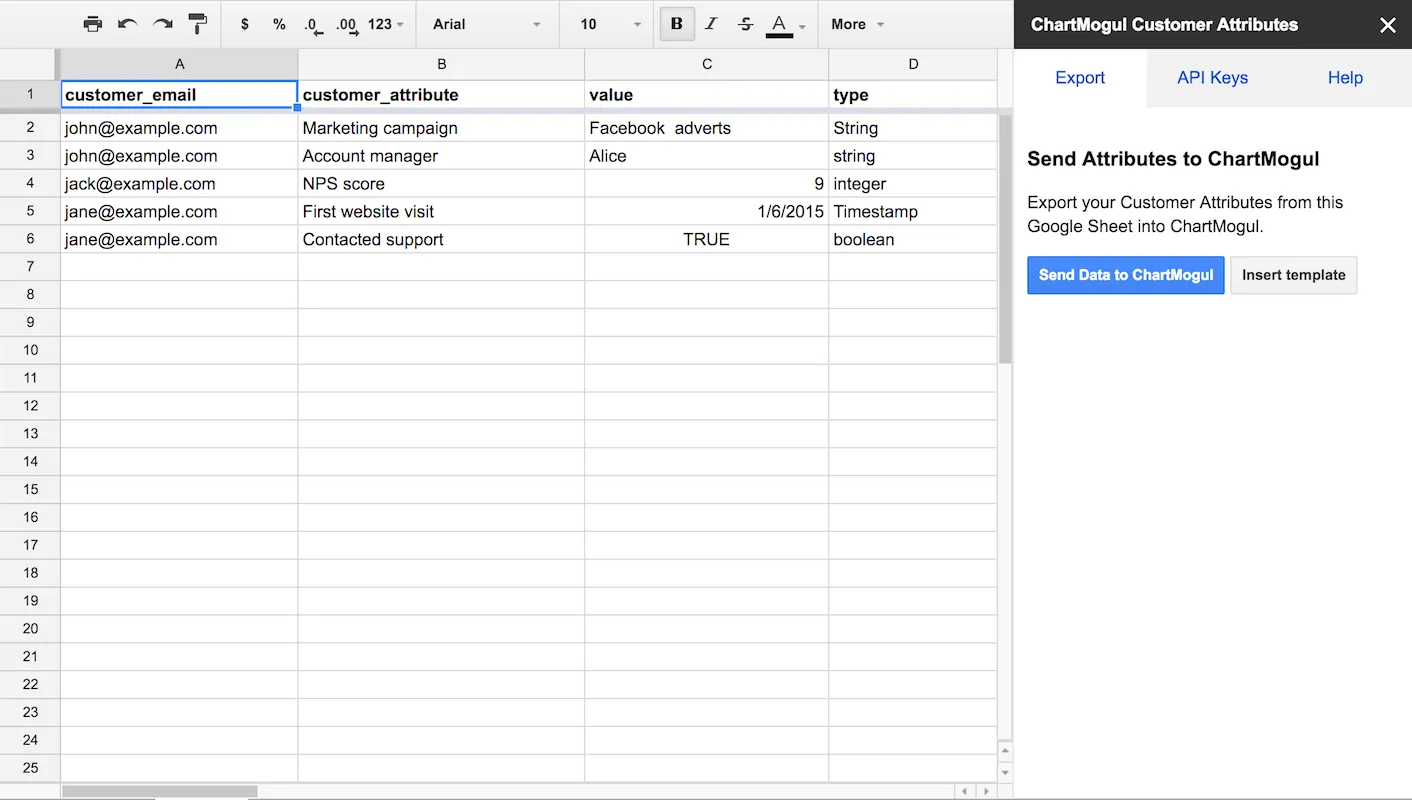
How does it work?
To use the Google sheets app:
- Install it from the Google web store
- Insert your data and ChartMogul API keys
- Finally, click “Send to ChartMogul”
You can find the full instructions here.
This enables you to import customer attributes without writing a single line of code.
See it in action
This is just the beginning
This is just the tip of the iceberg of what customer attributes will help you achieve. Your metrics will become more actionable with every customer attribute you import, and we’re hoping our new Google app will make this a whole lot easier.
Also, if you have a minute when using the app, I’d love to hear your feedback.
Other ways to import your customer attributes
- Developers can import customer attributes programmatically using our Enrichment API.
- Create one-click integrations with your other apps using our Zapier integration.