Marketing attribution is a notoriously difficult topic, as it involves multiple points of uncertainty: lack of data, duplication, multiple user paths, different user intent etc. However, what’s always clear is the question on everyone’s mind:
“Where do our best leads come from?”
And until you get your processes, data, and most importantly, business understanding in order, the answer will likely be:
“Mostly organic traffic… but it depends what’s a good lead.”
Let’s see how to get past that stage of uncertainty and get from information capture to business impact.
Why is marketing attribution important?
In my role as RevOps lead, my daily challenges revolve around aligning various teams to maximize revenue. This involves ensuring that our marketing strategy is well-defined and informed by data. We want to make sure that every marketing dollar we spend is worth spending – either on short-term lead creation purposes or in mid/longer-term strategic positioning.
We want to calculate the Return on Investment (ROI) for each marketing campaign or initiative we launch. This is particularly important for a product-led growth company like ours, where we don’t get to speak to all of our leads and customers, which might bring additional insights.
Marketing attribution for startups and growing SaaS businesses
If you are a company that is launching marketing campaigns but your reporting is limited to the native Ad Platform reporting, then this is probably for you. If you are a company that has started doing marketing attribution, then you should also read through.
Everything that you see below has been designed for a B2B SaaS startup, which is running primarily in product-led growth motion. While most concepts should apply to other industries and growth models, they would probably need to be adjusted accordingly.
Start by really understanding your data
As a first step, you want to understand what each person does.
Imagine you have just 2 users. Each of them will log in from their browser or their mobile or even both. But those users are logged-in users, so you have their user_id, so you know it’s them.

But since people are always connected. They might do searches and logins from their home and their office, using VPN or not. You need to consider many different parameters. This can prove difficult, but possible. The same ideas apply since you can identify the user by their ID.

But what if they use the same VPN that is using the same shared IPs? Or if they work from the same coworking space, again with the same IP. Or maybe they are in the same family but working in different companies, and they both use a home laptop to search?
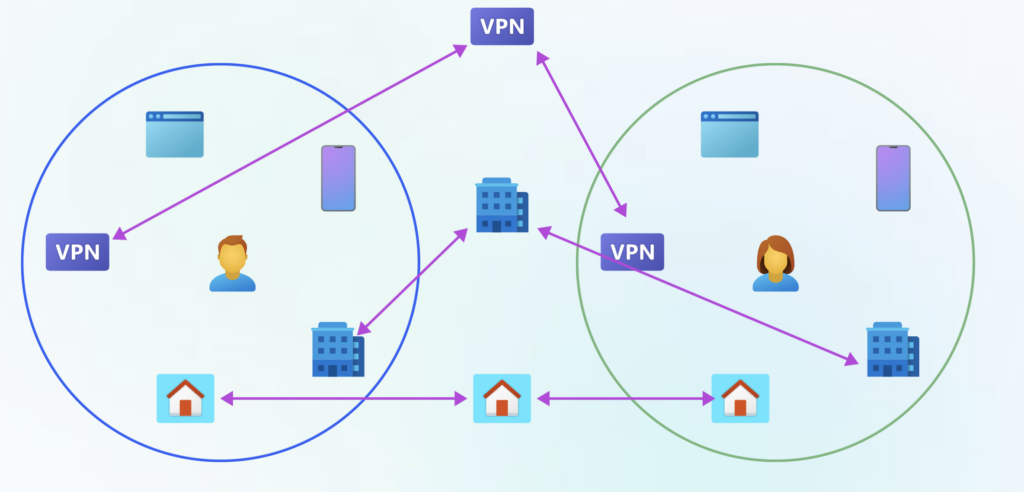
And what if all those things happen without the users being logged in to your app, but rather they are just visiting your website.
The complication increases exponentially, and that’s where you want to be careful to connect whatever belongs to the same user and only what belongs to that user.
If you don’t, you’ll either connect everything and end up wasting time, or fail to connect anything and lose all visibility into the user flow.

The pillars of marketing attribution
The marketing attribution journey starts with data collection. Without the raw data, you cannot move forward. Once you get the data, it’s time to connect them. This is probably the most challenging part, as it includes both deep technical and business understanding. Finally, it’s all about making sense and driving decisions out of all this data. And this is, of course, the most impactful. Inspired by ChartMogul’s journey, let me show you a step-by-step guide to building a marketing attribution model.
Capture data
Capturing data happens at many levels. The best thing is to capture as much data as possible from as many sources as possible. Depending on your setup, you will probably want to capture data from your website and app, from your blog and help docs.
You will need all sets of data: captured on the client browser or from your servers.
Then you need your data from the ad platforms. Things like Google Ads, Facebook, LinkedIn. They usually give you aggregated data, but there are pockets of raw information in there too.
For example, Google Ads give you the Google Click ID which can be vital in your modeling.
Finally, you should capture server logs. This is the hardest to analyze, but it is also the most accurate. Regardless of your scripts failing for whatever reason, the server will always tell you how many times a page was visited. At the very least, this is a great way to tell how well your scripts perform.
For example, if you see 10k page visits on the server but only 2k on your tracking script, something in your setup is going terribly wrong.
So in nutshell:
Track what is happening in your app/website:
- Client side events
- Server side events
- Capture as much as possible (while respecting user preferences)
- Save everything and see what can be used later
- Track across assets: website, blog, app, help docs — whatever you have
Tools such as Segment, Rudderstack, Snowplow are the most popular in doing such tasks.
Data from Ad platforms
- Usually aggregated (e.g. less helpful)
- But, some useful data as well
- Aggregated data also help to validate
Ad managers from Google, Facebook, Linkedin, whatever marketing channels you are using really. Try to get raw exports to the extent possible (e.g. Google Ads to BigQuery)
Logs from DevOps/Infra
- Logs are harder to analyze
- But, can tell the whole truth: nothing can give you the page views more accurately than the server log of how many times the page was served
The tools to get data from would be your AWS or Google Cloud or similar provider, and/or your CDN such as Cloudflare.
Connect data
Once you have all the data, it’s time to connect it.
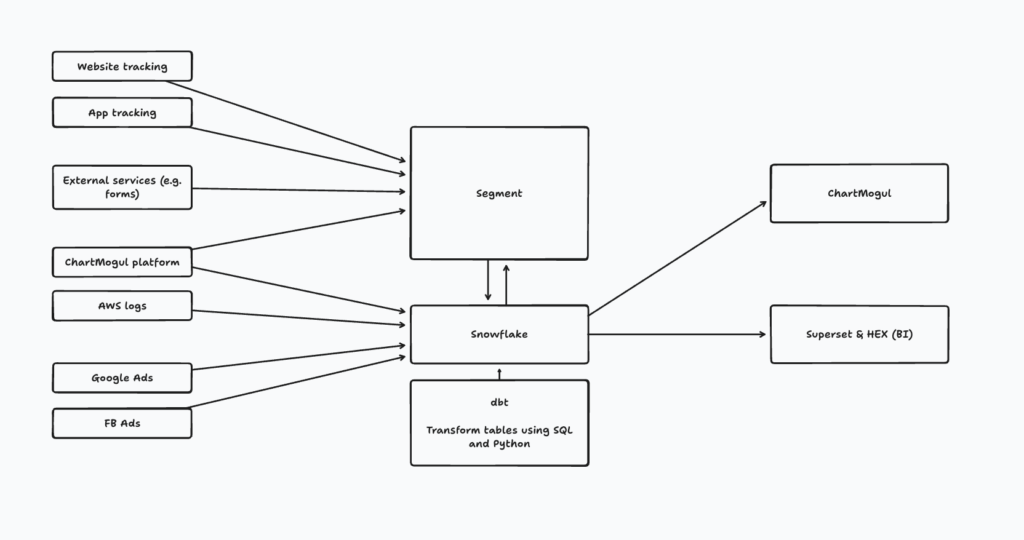
This is how we do it at ChartMogul. We do all the first-level tracking via Segment. We use Snowflake as our Data Warehouse, and we have multiple ETL pipelines that push other external data into Snowflake directly (e.g. data from our own ChartMogul account, Ad platforms).
So we have all our data in Snowflake. That’s a huge first step. All data available and in one place! Then it’s time to clean them and connect them.
We do that via dbt, which is a tool (pretty standard in data engineering) that helps you manage this modeling in SQL or even in Python.
Finally, the results are then visualized in our ChartMogul and also in custom BI dashboards for analysis and decision making.
This is how it all looks:
If we wanted to make it a checklist, it would look something like this:
Data capture
- Capture all data sources
- Bring them to a common place (i.e. Data Warehouse)
- Have a tool to model the data
Data modeling
- Find the unique identifiers for your data
- … or find ways to connect your data if no clear identifier
- Create models that can be analyzed by users
Activation and insights
- Make the data available for analysis
- Don’t restrict to one place — let people work where it makes the most sense for the use case
Keep in mind when capturing and connecting data
You will never have all the data you would ideally want.
Something to note on the whole process: You will never have all the data you would ideally want.
People block tracking, scripts won’t load, random errors will happen.
It doesn’t matter.
Once you have verified your approach, have tested against something more robust like the server logs, and know that your results are consistent and accurate but only capture 70% of the leads, that’s fine. You now know that you are missing 30%. But you also know that you are comparing 2 campaigns on the same basis.
Your decision making is practically unaffected.
And how do you know when your capture quality is good enough?
I follow this three-step guideline, to know when capture quality is good enough:
- Test with real-world data. Experiment and understand behavior with real data, including known corner cases
- Review key business metrics. Regularly review key business metrics such as customer acquisition cost, customer lifetime value, etc
- Continuous iteration. Make sure the models are easy to understand and gather feedback from GTM teams to refine and improve the models continuously.
Bring business value
Let’s take one example of linear marketing attribution. Basic attribution on sign up conversion.
A user searches for something, clicks the ad, visits the website, signs up, a new lead is registered.
Google ads reporting captures one more conversion.

Let’s see a more detailed example of this:
- A user wants an app to manage their personal tasks
- Searches for Task management software
- Sees a bunch of results, one of them looks interesting and says “Free”
- So they click and sign up for Jira
- Conversion tracked ✅
But how about the potential value of this user? ❌
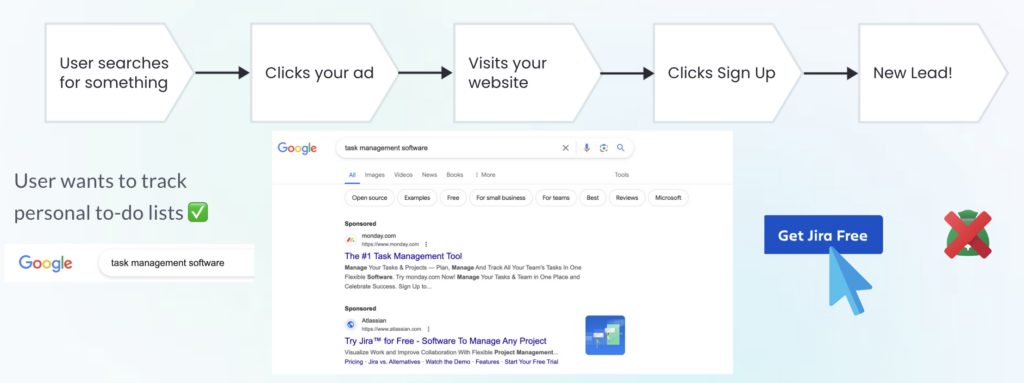
This was a clearly bad-fit lead. However obvious this might be to some (who would possibly sign up to Jira for personal to-dos), there are numerous cases of mismatch.
ChartMogul is a subscription analytics company. It’s extremely possible that someone ends up in ChartMogul looking for a general-purpose BI tool!
Let’s see this example from our own data
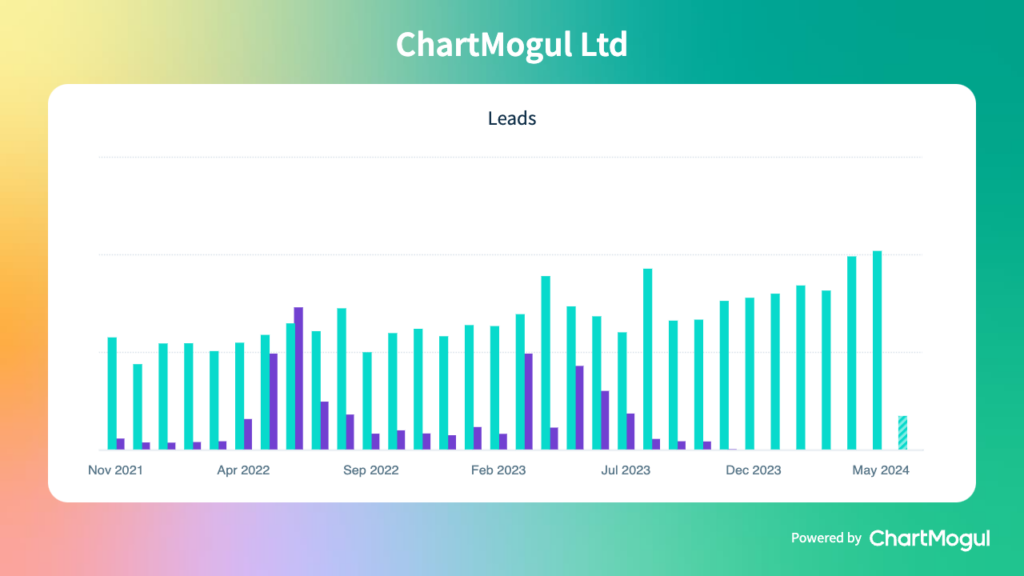
This is the number of leads created by month.
The light green segment is our main way of acquiring leads through a free trial.
The dark blue segment is leads generated via gating some of our content and doing marketing campaigns to promote it.
At its peak, the gated content segment was performing really, really well – the two segments had a small difference, and in some cases, gated content outperformed trials!
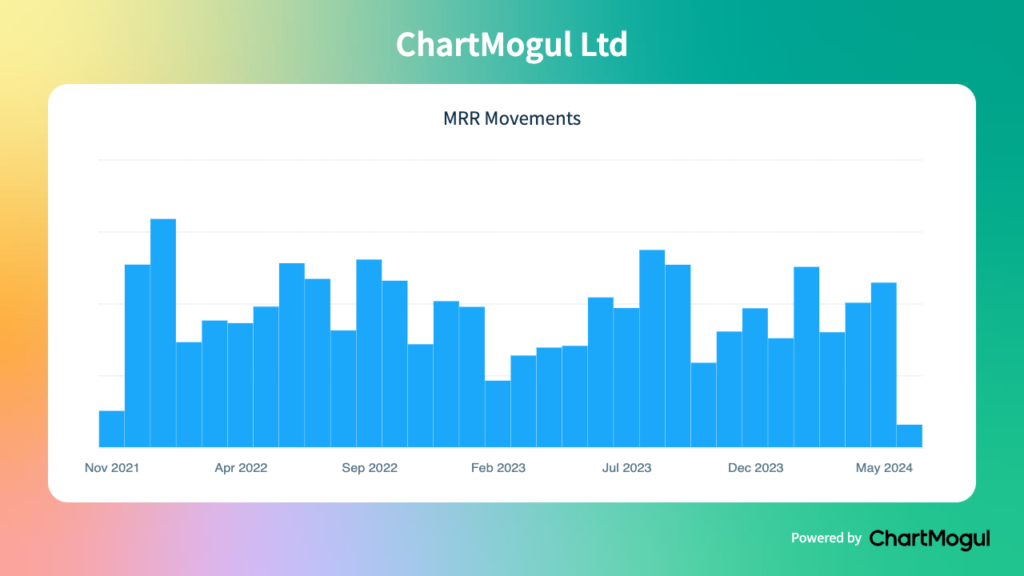
Now let’s look at MRR from these 2 segments:
New MRR from trials
New MRR from gated content
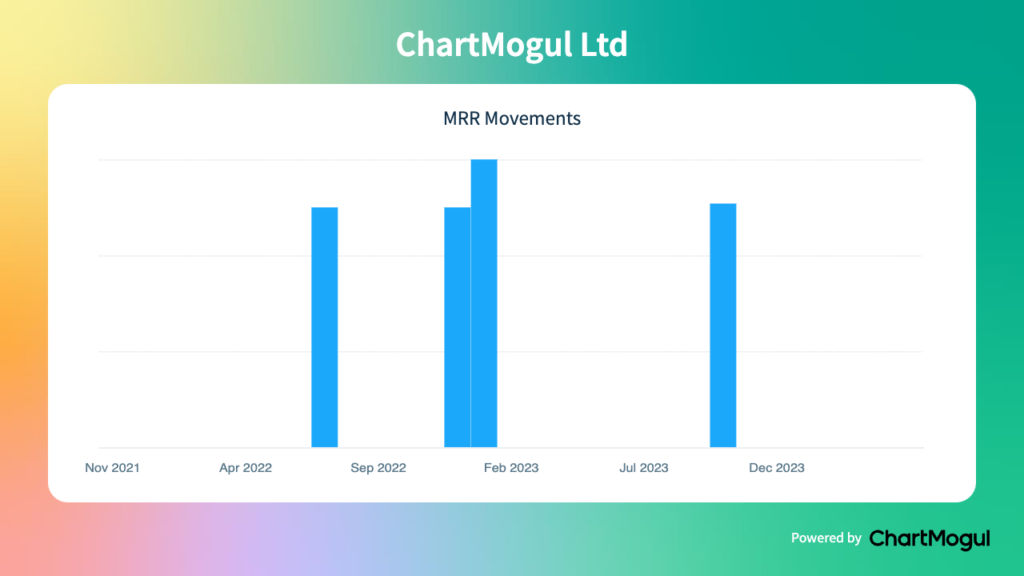
Not quite the same, right? Now light green performs orders of magnitude better. You might still want the dark blue leads, but at least you now know how much they are worth!
Instead, we made the brave decision to ignore the low-performing leads, open it up for public ungated view, and essentially move it 1 step earlier in the marketing funnel.
This is what happened:
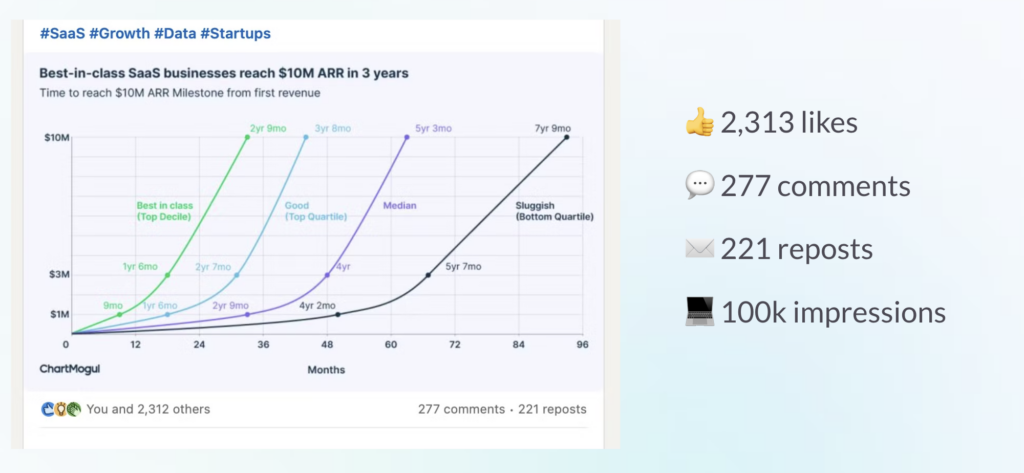
The social media, brand recognition, and thought leadership results were mind-blowing. And none of this would have happened without being able to connect all dots to the MRR level.
If you’re just starting your marketing attribution journey
Marketing attribution is a big topic and almost never a one-size-fits-all solution. In sum, what we did, and our advice to someone who’s just starting this journey, is the following:
- Build your attribution system based on what fits your business and with the desired end model in mind.
- Work with what you have. Don’t wait for the perfect data that will probably never come.
- You need a combination of technical and business expertise. Don’t underestimate either.
Marketing attribution FAQ
What is marketing attribution?
Marketing attribution is all about figuring out which marketing efforts are driving results: sign-ups, demos, or subscriptions.
What is a marketing attribution model?
An attribution model is a framework used to analyze which touchpoints or marketing channels are most effective in influencing customer decisions. It’s a way to connect the dots between the customer journey and the marketing campaigns or marketing channels that influenced their decisions. Whether it’s an email, a Google ad, or a webinar, attribution helps you see what’s working (and what’s not) so you can focus your energy—and budget—on the strategies that deliver the best ROI.
Why is marketing attribution important?
Selecting the right marketing attribution method is crucial to effectively measure marketing channel effectiveness and improve decision-making.
What is a linear attribution model?
One common approach in data modeling is the linear attribution model, which assigns equal credit to all marketing interactions throughout a customer’s journey.
What is multi-touch attribution modeling?
Multi-touch attribution modeling is a way to figure out how each marketing touchpoint—like ads, emails, or social posts—contributes to a customer’s journey, so you can see what’s really driving results.
How can I do marketing attribution?
There are various ways to do marketing attribution. The main categories are a) using a specific marketing attribution software or b) model it using your own tools such as event tracking, data warehouse, SQL and/or Python.
Can I see it in my existing web analytics tools like Google Analytics?
While Google Analytics or similar web analytics tools can give you an out-of-the-box overview of your traffic and, to some extent, user acquisition, they are not designed (out of the box, at least) to provide the granular understanding we want per marketing initiative. You would either need a new tool/DIY process or a very much customized Google Analytics setup.
