We’ve been thinking a lot about Churn recently and have come up with a couple of best practices depending on what type of business you’re running.
B2B
With B2B the standard formula (and usually most appropriate) is to take the number of Customers at the start of a period (minimum of one month), and then see how many of these customers dropped off by the end of that period (ignoring any new customers that came in during the period). So if you had 100 customers on the 1st of July and 10 cancelled during July then the Churn rate for July would be 10%.
For revenue churn rate you take the MRR at the start of the period and calculate the % change at the end of that period (ignoring the impact of any new customers who purchased during that period). So we’re looking at the net effect of expansion, contraction and churn on MRR over a given period. If you’re very lucky your MRR will have gone up, e.g. you’re in negative churn territory (aka SaaS nirvana).
We also recommend measuring churn separately for each subscription plan, or at least grouping plans with the same subscription length together and measure the churn separately for each group, e.g. a separate churn rate for monthly plans vs annual plans.
Mixing annual plans in with monthly plans can artificially reduce your churn rate – this is particularly true if you have a lot of annual plans but few of them are up for renewal in the period you’re measuring. Also customers paying annually have a different mindset and level of commitment to your service so measuring their churn rate separately makes a lot of sense for most businesses.
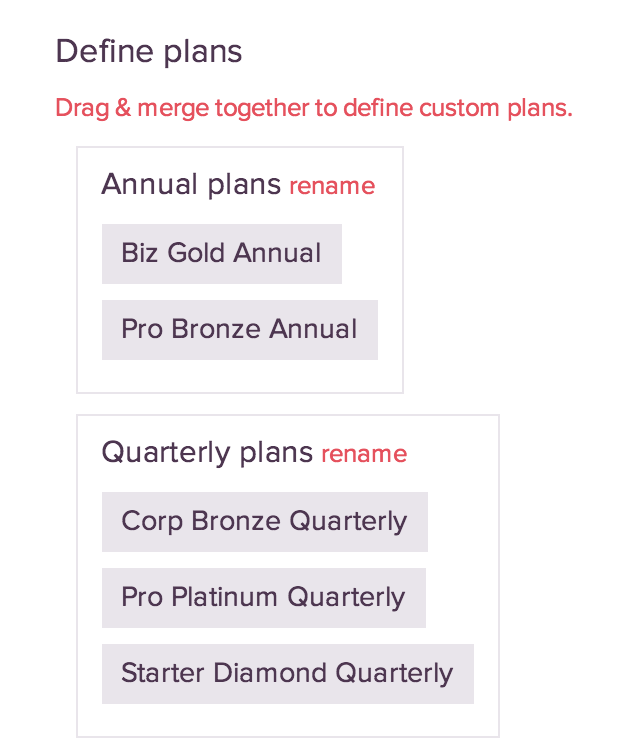
In ChartMogul you can group plans together (e.g. by billing period)…

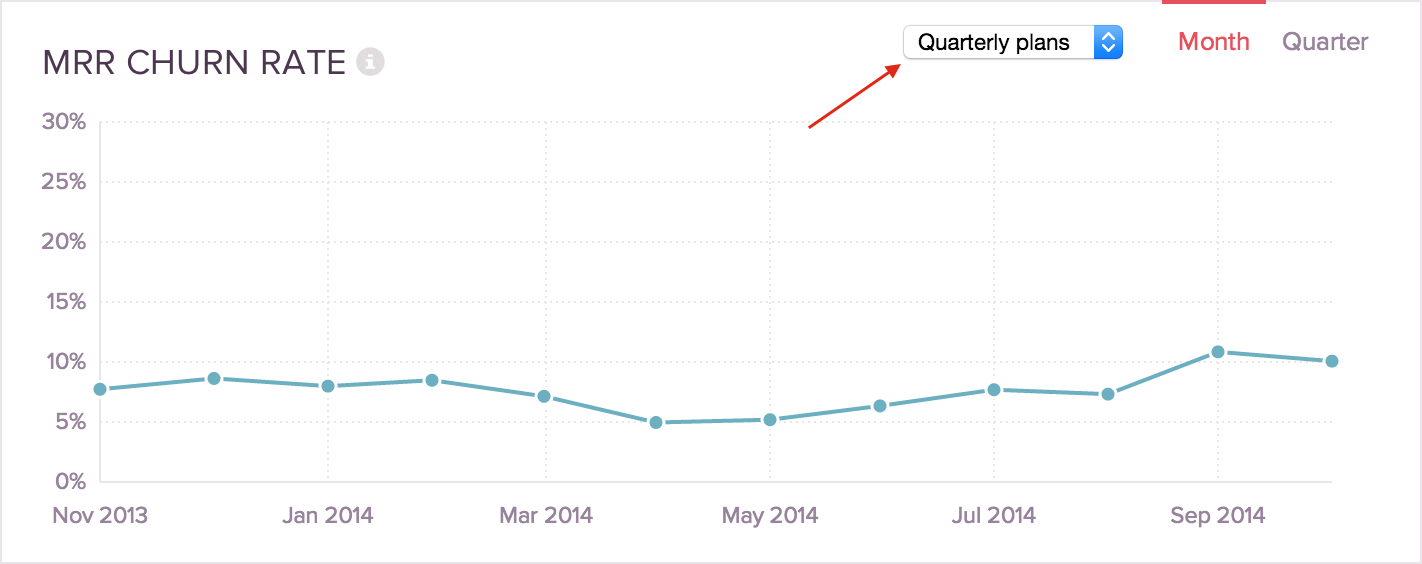
…and then drill-down into your churn graphs by plan group:

When churn isn’t the right metric
If you’re a startup with mostly annual subscriptions and haven’t been in business that long, then a churn graph may not be a very useful metric until you’ve had more time to collect the necessary data to make it meaningful. In this scenario we recommend looking more at your retention. A retention graph works by looking only at customers who are up for renewal in a given time period and then see’ing what percentage actually renews.
B2C
For B2C subscription businesses such as Netflix, Spotify or Birchbox, where there are thousands of new customers being added each month with little expansion/contraction and mostly monthly subscriptions where customers can cancel at any time, then the standard churn method isn’t necessarily the best approach.
We first became aware of an alternative approach from this excellent blog post by Devin Brady at Recurly. That was in turn inspired by this post by Steven H. Noble from back in 2011.
I recommend reading these posts to fully understand the thinking and rational behind these formulas to see if they are suitable for your business.
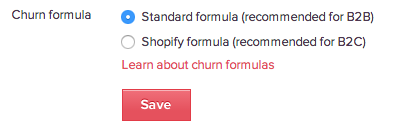
At ChartMogul we’ve decided to give our customers the choice of two churn formulas based on the two schools of thought outlined above.

