
Many people love using Intercom as a tool for understanding how customers are using their product, providing awesome customer service and generally being closer to them. I’m guessing a lot of people see the Slipping Away segment that’s built into the product and shown in the top menu bar:

Wait… What?! Disaster! 784 users are “slipping away”! We must take action. Someone take action.
But wait a minute. What if you could actually know what those 784 users represented for your business in terms of MRR? This way, you could actually see that recurring revenue that you’re slowly losing grasp of, as it gently drips from the leaky churn-ridden bucket that is your subscription business.
You can get this data. Using a combination of Intercom, ChartMogul and Zapier, we can view all of the relevant SaaS metrics for the customers in this segment. Allow me to show you how…
You’ll need:
- An Intercom account, with users (duh).
- A ChartMogul account (grab a free trial here and import your data from your billing system).
- A Zapier account (Zapier connects events in Intercom with ChartMogul data).
Step 1: Activate the Zapier Zap

Zapier’s integration with ChartMogul means that you can connect all kinds of other platforms to your ChartMogul data. In this case, we’re going to use a ‘Zap’ (Zapier app) which connects ChartMogul to Intercom.
Here's the one you want:
Add new tags in Intercom to ChartMogul customers
- Go to the page for the Zap, and click “Make this Zap!”
- Connect your Intercom and Zapier accounts, providing the required information.
- When you get to the Action Fields step, follow the instructions to choose Tag Name. Useremail should already be selected in the second text field.
- Click Save + finish! The Zap will be enabled after a few seconds of behind-the-scenes magic.
Step 2: Tag the Slipping Away Intercom users
Now that we’ve enabled the above Zap, any user tag added in Intercom will be instantly pushed to the corresponding user in ChartMogul. Cool, huh? Let’s do some bulk tagging.
- Log in to Intercom, and click the Slipping Away menu item.
- You’ll see that by default, Intercom uses the following definition of “Slipping Away”:
"User was last seen more than 10 days ago AND less than 60 days ago"
- If you can define this better for your own business, now is the time to tweak it. You can change any of the filter settings on the left until you’re happy with the definition.
Tip: One interesting approach is to look at users who have a high number of total web sessions but are no longer logging in very much. These are likely to be once-active, now disengaged users. Either that or they went on a very long vacation.
- Now, hit the Tag button. This will tag all of the users that fall within your criteria. Let’s call the tag “Slipping away”. Once you create the tag, the Zapier-powered back end will get to work pushing all of those tags straight to your ChartMogul account. Time to go and see the results...
Step 3: View the data in ChartMogul
To enjoy the fruits of your labor, follow these steps:
- Log in to your ChartMogul account.
- Once you’re at the Overview page, click Add Filter in the filter bar at the top.
- Select the Tags attribute from the dropdown list and "has all of the following" in the 2nd dropdown. Now type our tag name in the 3rd box - “Slipping away”. Click Add.
- Et voila! The data has now been filtered to your “Slipping away” customers. Take a look at the MRR!
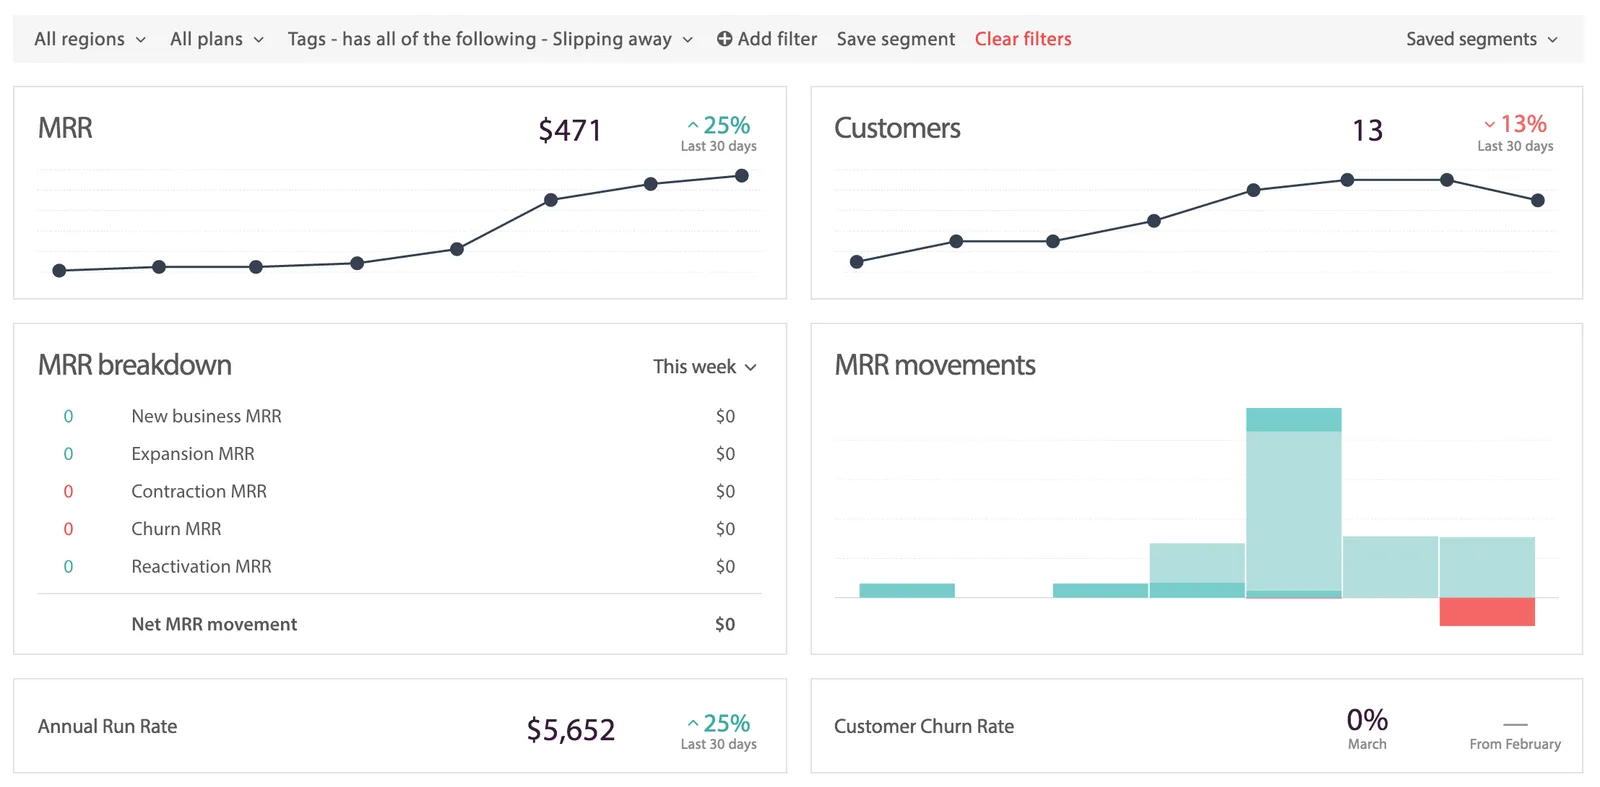
We can see that:
- The MRR of “Slipping away” customers is $471
- It has increased 25% from the last 30 days
- ARR is $5,652
- This represents 13 customers (and I can click through to see them)
Using these insights into your customers, you can make far better decisions and take more decisive actions towards the growth of your subscription business.
Actually, the above example scratches the surface of what you can do with the Segmentation and Integrations available in ChartMogul. We'll be sure to offer more guides and walkthroughs in the future, but for now go and check out the announcement of our Zapier integration or the ChartMogul Help Center to read more.