At ChartMogul, our mission is to help you measure, understand and grow your subscription business. Today we’re taking a big step towards helping our customers grow their revenue, with the launch of a new set of features we call Segmentation.
Introducing Segmentation
Segmentation is vital when it comes to growing subscription revenue, because it allows much deeper insights than high-level metrics. For example, viewing Customer Lifetime Value (LTV) per marketing channel is far more actionable than a global LTV metric.
Segmentation lets you answer hundreds of new questions about your customers, such as:
Which marketing campaign brought in the most Monthly Recurring Revenue (MRR) last month?
Which industry verticals have customers with the highest LTV?
You could even generate a list of large customers who are coming up for annual renewal this month, or see what the churn rate is for customers who were given discounts.
Add context to your customer data

To make the most of Segmentation you need to enrich the customer data in your account. You can do this in the following ways:
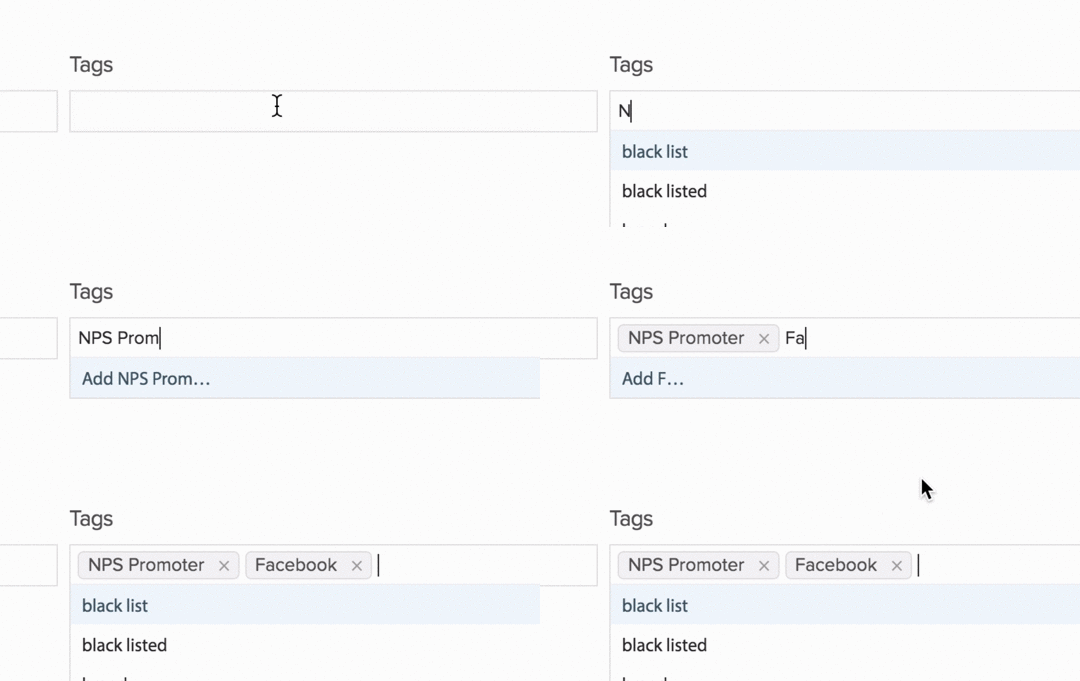
- Manually tagging customer accounts in ChartMogul – if you have customers that you want to tag with specific information, you can do this with tagging.
- Using our new Enrichment API – Allows you to programmatically add metadata to your customer records in ChartMogul, which can then be used with Segmentation. This allows you to pipe in data from external sources such as Salesforce, Hubspot, Intercom, etc. or a data warehouse solution, and use it to segment your metrics in ChartMogul. (Read the API documentation here).
Segment your SaaS metrics in ChartMogul
Once you’ve added the customer metadata that’s important to your business, you can then put it to work by saving segments and drilling into the SaaS metrics in your ChartMogul account. You can create segments based upon collections of customer parameters that you’ve added to your customer accounts.
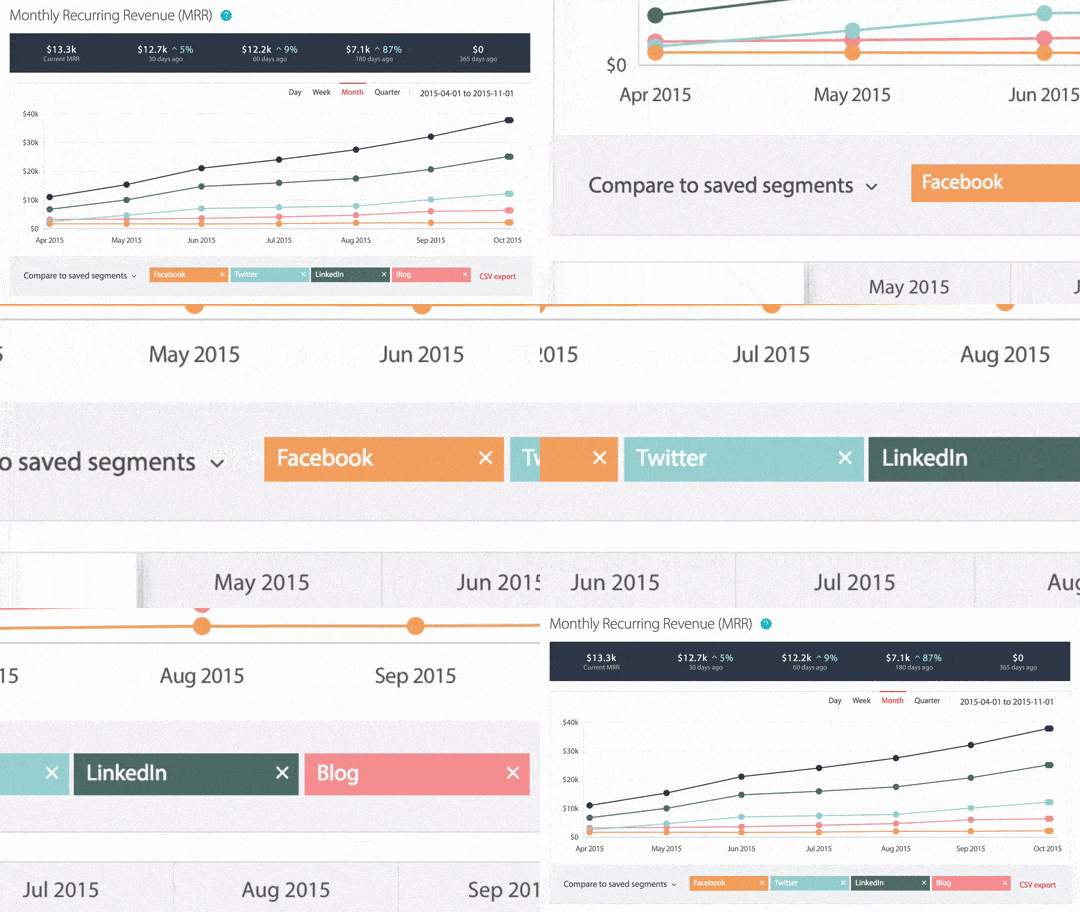
Almost all of the analytics you see in ChartMogul can be segmented. Select a saved segment as a filter in the dashboard. You can even compare multiple segments on the same chart, such as MRR broken down by Marketing channel.
Over the coming weeks we’ll be publishing a series of articles giving you tips and guidance on how to pipe in external data using the Enrichment API. We’ll also be releasing ‘connectors’ such as a Zapier ‘zap’ (contact us if you’d like to try this before it’s made public) to make it really easy to pipe in data without needing to write any code.
We’re excited to see what you can achieve with Segmentation. If you have a ChartMogul account, you can log in and start using it right away. If you haven’t signed up yet, you can start a free 14-day trial to start using the features.
