
This week in our Tips and Tricks series, we take a look at how time to convert to a paid account can have an impact on the eventual churn rate among paying customers.
Knowing which customers are at greater risk of cancelling is key to reducing churn. Segmentation in ChartMogul lets you find and view groups of customers that are a greater risk of churning. One key indicator of high churn risk is the length of time it takes to convert a customer to a paid plan (sales cycle length).
"Time to convert to a paid account" is a proxy for many issues related to on-boarding, including:
- Technical difficulty setting up the account
- Low product engagement during the trial period
- Organizational issues with access to the account
All of these issues (any many more) can contribute to a higher churn risk.
In this article, we'll use the Trial-to-paid in daysfilter in ChartMogul to answer the question:
"Does sales cycle length impact churn rate?"
Setting up segments to compare
To achieve this analysis, we will need to set up two custom segments in ChartMogul.
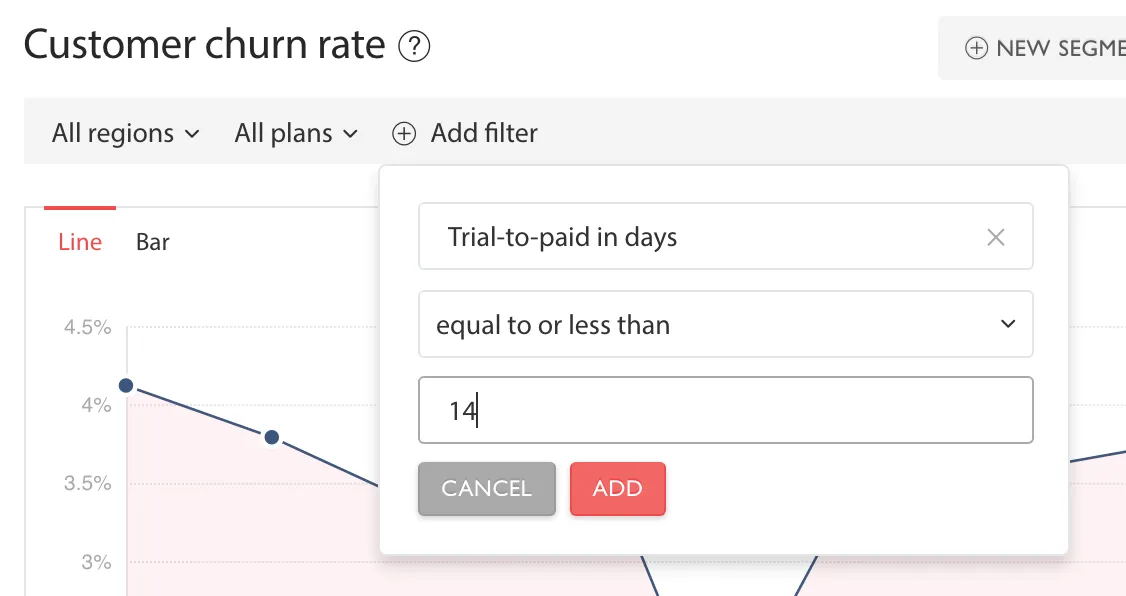
- Log in to your ChartMogul account and go to your Customer Churn Rate chart
- Click Add filter then select Trial-to-paid in days- equal to or less than-14
- Save this as a segment and name it something like "Converted within 2 weeks"
- Click New Segment,then Add filter and select Trial-to-paid in days- greater than-14
- Save this as a segment, and name it something like "Converted after 2 weeks"
What we're doing here is creating two segments:
- A "long sales cycle" segment (2 weeks or less)
- A"short sales cycle" segment (more than two weeks).
Depending on your product characteristics and trial length, you might want to customize these to better represent your own sales cycle.
This custom segment will highlight whether customers who converted to paid within two weeks of signing up are more likely to churn than customers who took more than two weeks to convert.
Viewing the data
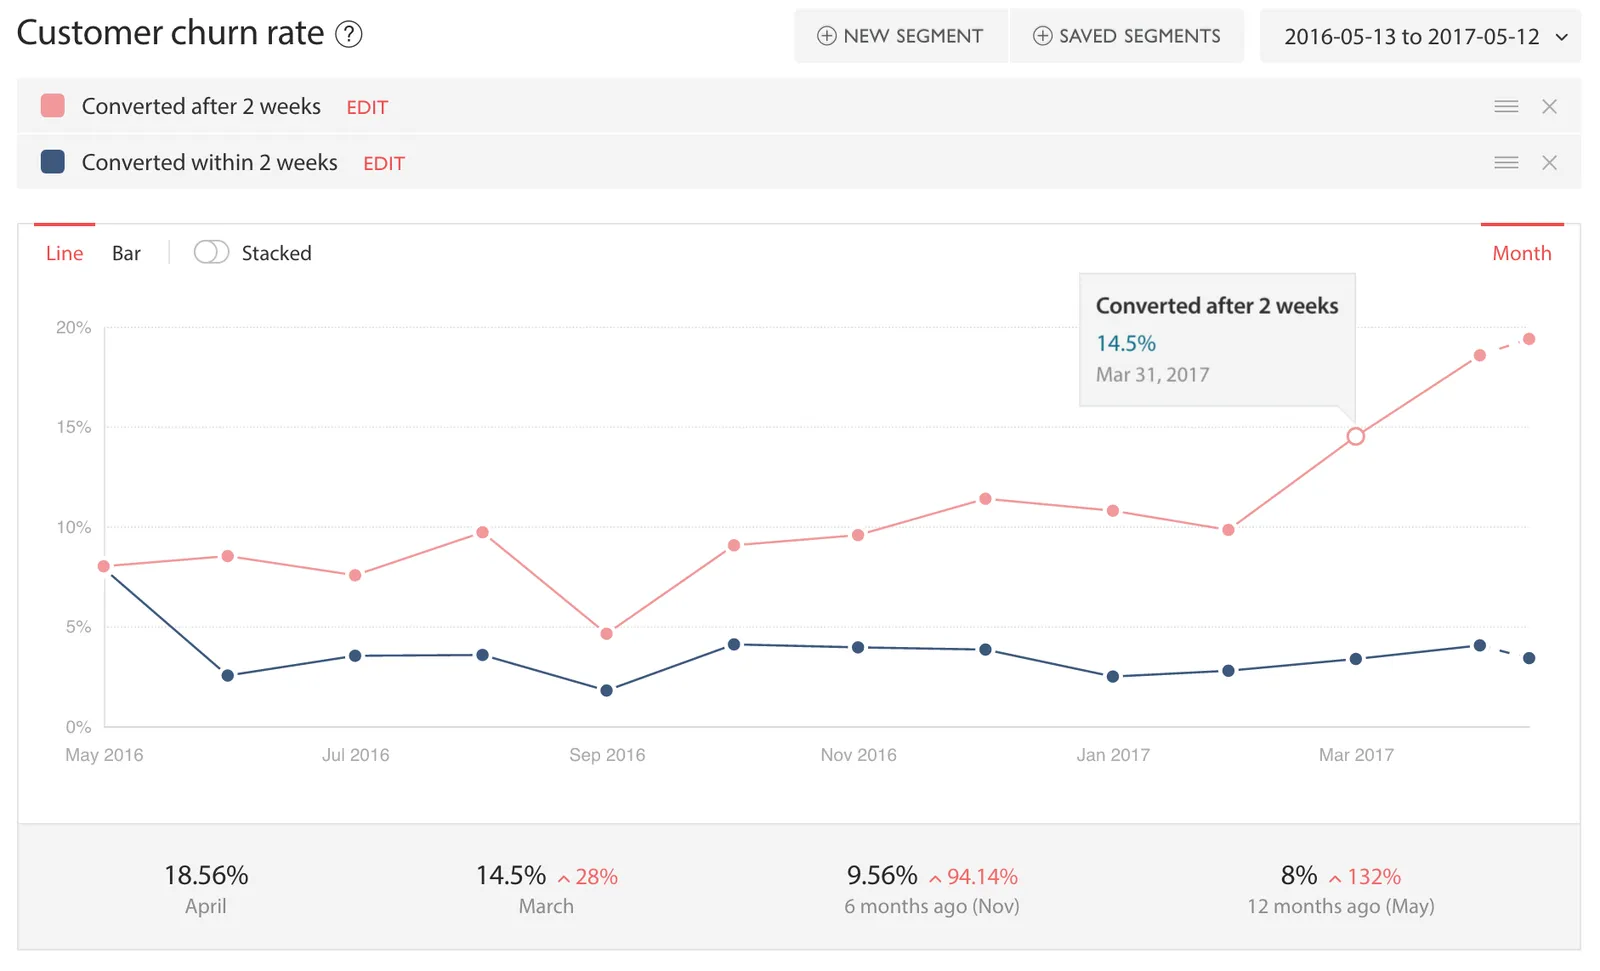
In the Customer churn rate chart, we can see a correlation between sales cycle length and customer churn rate:
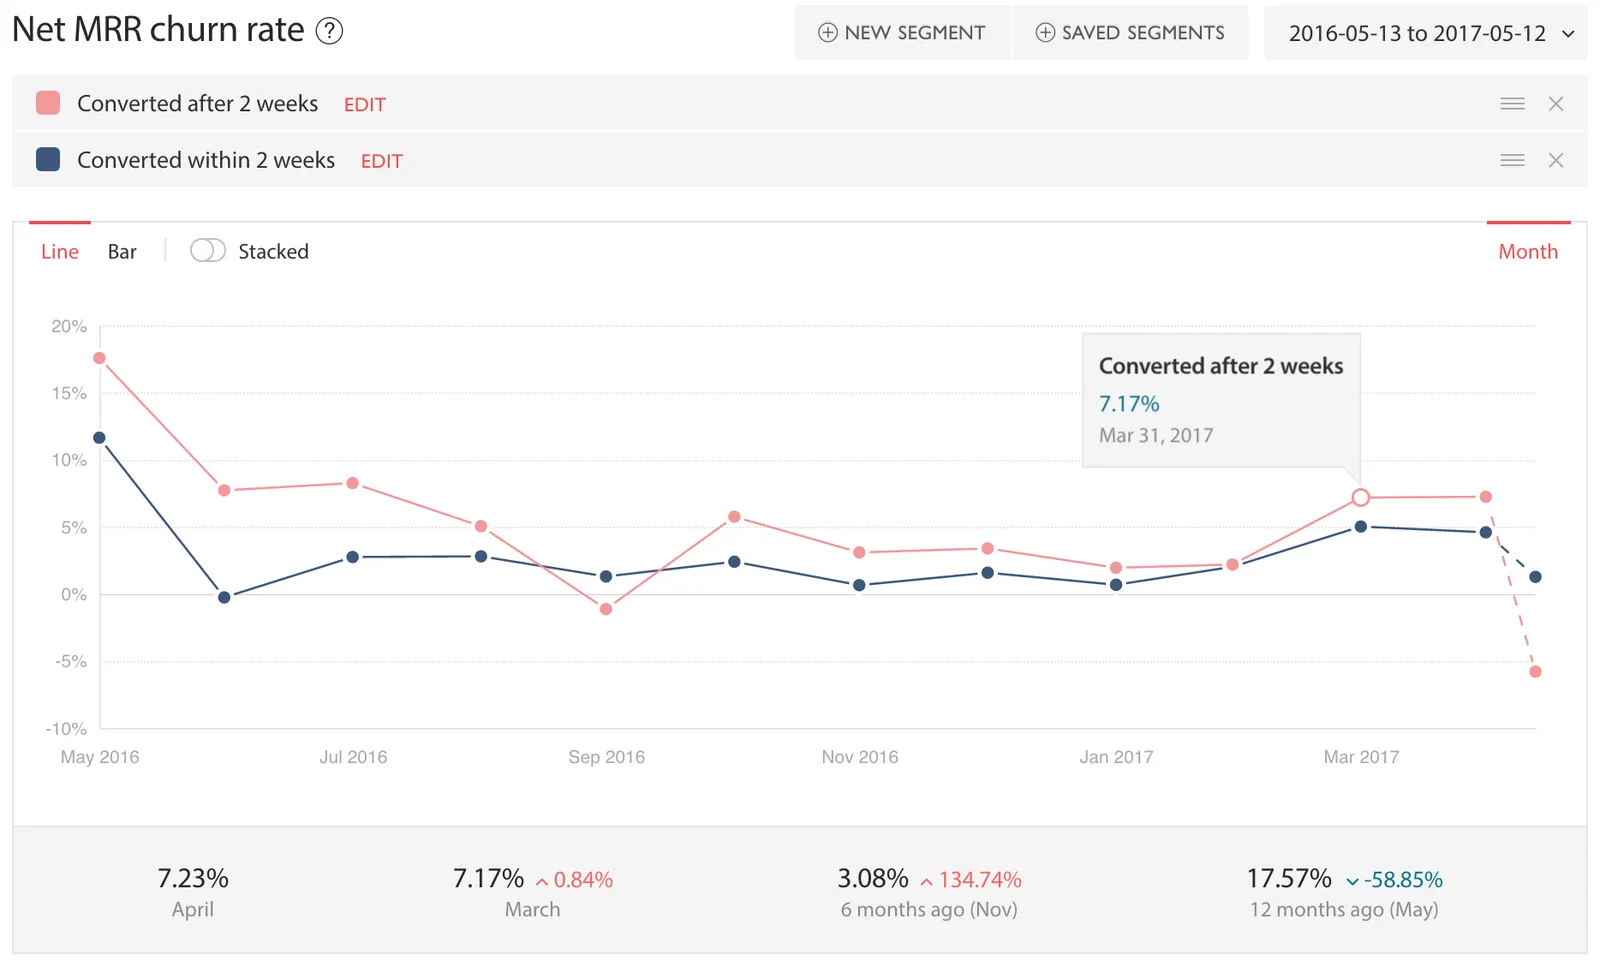
We can also see the same correlation on the Net MRR churn rate chart, though the difference between the segments is less pronounced:
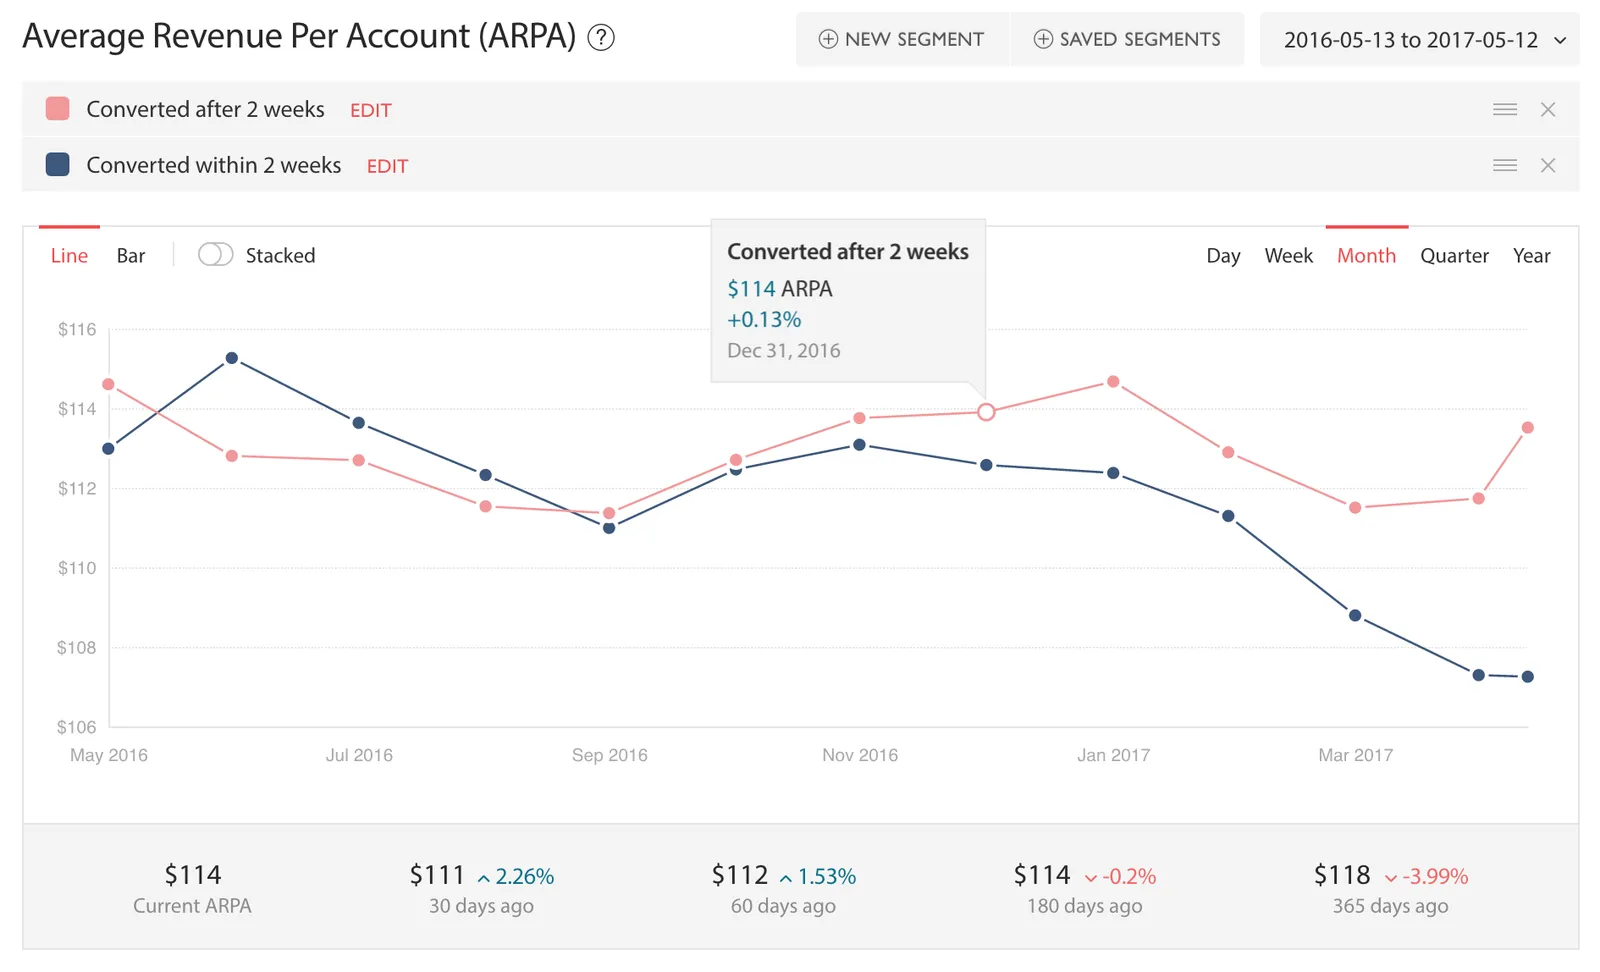
Looking at the Average Revenue Per Account (ARPA) for the two segments, we can see that the customers that take longer to convert are also more valuable customers (higher ARPA). It's possible that the customers in this segment are larger deals.
What we learned
For most businesses, the characteristics shown above represent a problem that should be addressed. We have learnt so far that customers who take longer to convert:
- Are at a greater risk of churning
- Have a higher ARPA than other customers
To address this problem we could:
- Provide a higher level of support to customers currently who have a higher risk of churning
- Address the on-boarding problems or other friction experienced by customers who don't convert within 14 days
- Investigate whether these actions succeed in driving down churn rates by looking at your customer churn cohort analyses
These suggestions for potential churn rate reduction are a good starting point for your own customer retention strategy.
Next steps
For more accurate results, you should consider the expected trial period for each plan, rather than on a global level. You can do this by filtering to a single plan and using the Trial-to-paid in days filter. This lets you see the plans with more problematic onboarding, and those with a higher churn rate. You can also see which plans receive the most trial extension requests before converting to a paid account.
You can also use custom attributes in ChartMogul to track the impact of NPS and customer health scores on your churn rates. This gives a good indication of which customers are at a greater risk of churning.
Using Segmentation, David Apple from Typeform found that “someone who gives us a low score on the NPS is still less likely to churn than someone who didn’t respond at all”. Read more in this article.
There are many attributes that you could add to customers that indicate an increased churn risk. Other examples include tags such as:
- 'price sensitive'
- 'low usage in trial'
- 'has open support tickets'
- 'support provided in non-native language'
You can add attributes and tags to your customers in ChartMogul, using an Enrichment integration, or by using the Enrichment API.
Share your analysis
Do you have a particular analysis in ChartMogul that has helped gain unique insights? Do you think it could help other users? Please send it to us at support@chartmogul.com.