Churn rates can keep business owners and leaders up into the wee hours of the night, head-scratching why it can’t be reduced to a reasonable amount. But have no fear: a high churn rate is an opportunity to improve!
It highlights the bottlenecks and weaknesses of your brand’s customer experience. When churn starts to subside, it can indicate the brand is delivering exceptional quality service that is capable enough to earn customer loyalty.
While a business may be capable of acquiring new customers at a rapid pace, keeping your current customers on board is mission-critical to your team’s success. According to Wheelhouse Advisors, 70% of companies say it is much cheaper to keep their existing customers than acquiring new ones.
In our case, we used ChartMogul to perform churn analytics and combined this with our own product Usersnap to get feedback on why customers were leaving. We were able to figure out why our churn was so high. It gave us the necessary food for thought to innovate, and create new offers for our customer base to give them more moments of delight while keeping them with us for a longer period of time.
Using ChartMogul for quantitative data
Being one of the most promising platforms for consolidating and streamlining billing data, we onboarded with ChartMogul as part of our customer behavior strategy.
Since we are a customer-centric company, it is essential to have the right tools that address their decisions and voice. It integrated easily with our brand’s technology stack, and given the fact that we want to deliver products that blow our customers’ minds, ChartMogul gave us the dashboard we needed to better understand our customers.
We connected it with relevant billing service providers so we were in a much better position to track quantitative data from a centralized location. Monthly recurring revenue (MRR), customer lifetime value (LTV), churn rates, and the overall business performance were on the dashboard and easy to view.
Importantly, there were no expert requirements to manage the software, which meant smart brains with little technical knowledge could get down to the business of helping our customers build feedback-driven products.
Collecting qualitative feedback from customers
ChartMogul was quite helpful in terms of highlighting the number of customers that left us, however, we also wanted to know why they were leaving.
We, as many companies do, “ate our own dog food”, and placed our own qualitative feedback collectors at various customer interaction points.
Usersnap’s calling card is about getting actionable user feedback, whether it is screenshot bug reports or experience ratings, and anything in-between. We live and breathe customer-centricity, and placing our product along their journey gave our customers the full opportunity to provide their honest feedback about their experience. This helped us to get valuable insight into the underlying reasons for churning, and improve our overall decision-making.
No matter which feedback collection company one decides to go with, these examples were quite useful for obtaining the qualitative feedback needed to triage and take action:
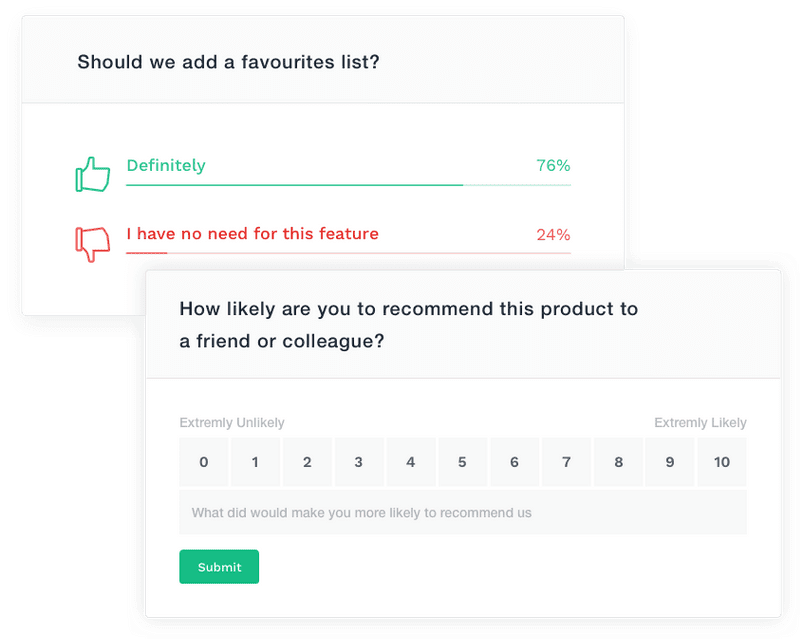
Quick pop-ups
A non-intrusive pop-up was quite helpful in getting the required feedback. When embedded into a website, it allows customers to share what they are thinking about regarding our brand, website, and products.
Feedback buttons
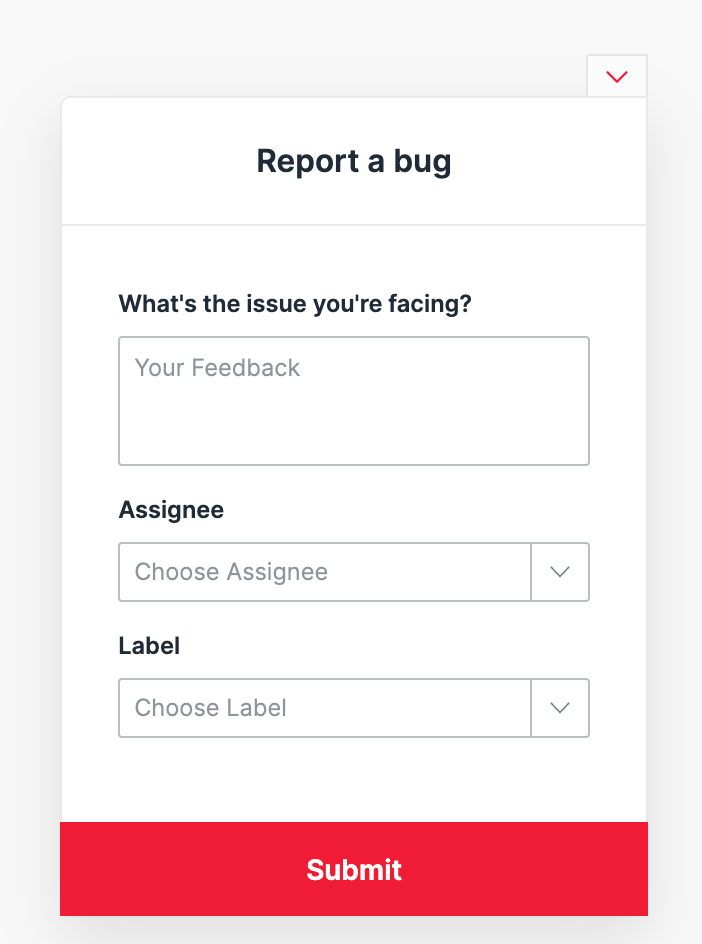
We also employed a more passive and subtle way to collect feedback. Since it is a two-step process, customers clicking on the button are more likely to leave an actionable remark. This puts the ball in their court: instead of us asking for feedback, we make it optional and find out who actually cares, as well as what they care about.
Follow-up emails
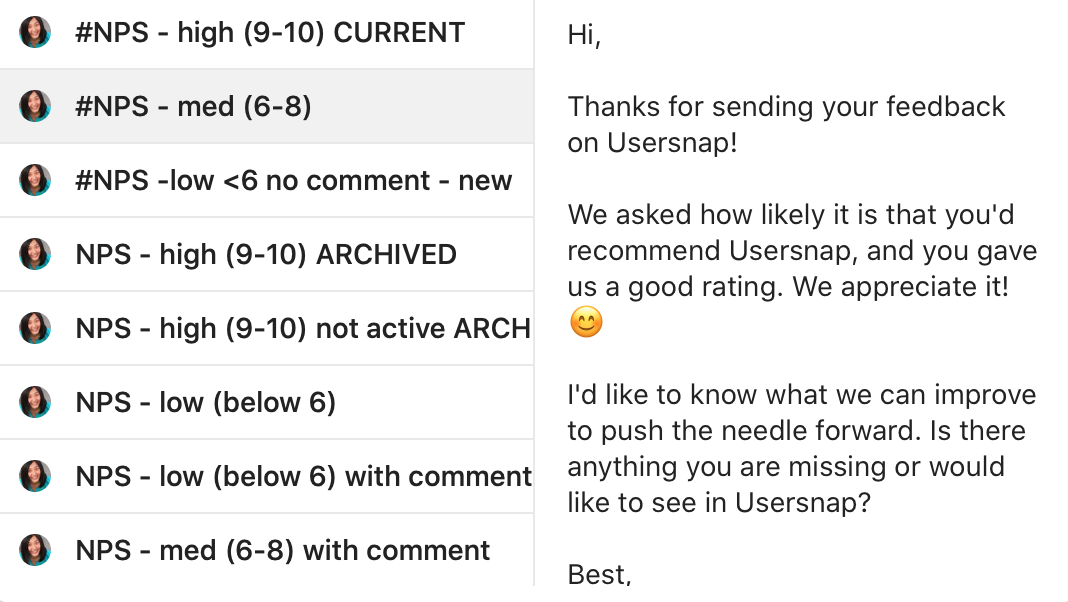
When a user is aligned with what we believe in (and purchases our product), we send an email to the customer asking them about the overall service quality and their experience. We also use that opportunity to get valuable information about our brand, and how we can further improve.
Apart from these, there are plenty of active ways to collect feedback. For instance, we also use live chat so our Customer Success team can directly talk to the customer about their experience when we are approached. Choosing the right strategy and taking your target audience into account are crucial to this.
Deploy surveys at churn points
Maybe you’ve tried to uninstall a program or even tried to disable your Facebook account and noticed that they have a built-in system that inquires about the reason for leaving or stopping to use that service. It allows them to collect accurate information at the point of churn.
That’s exactly what we did.
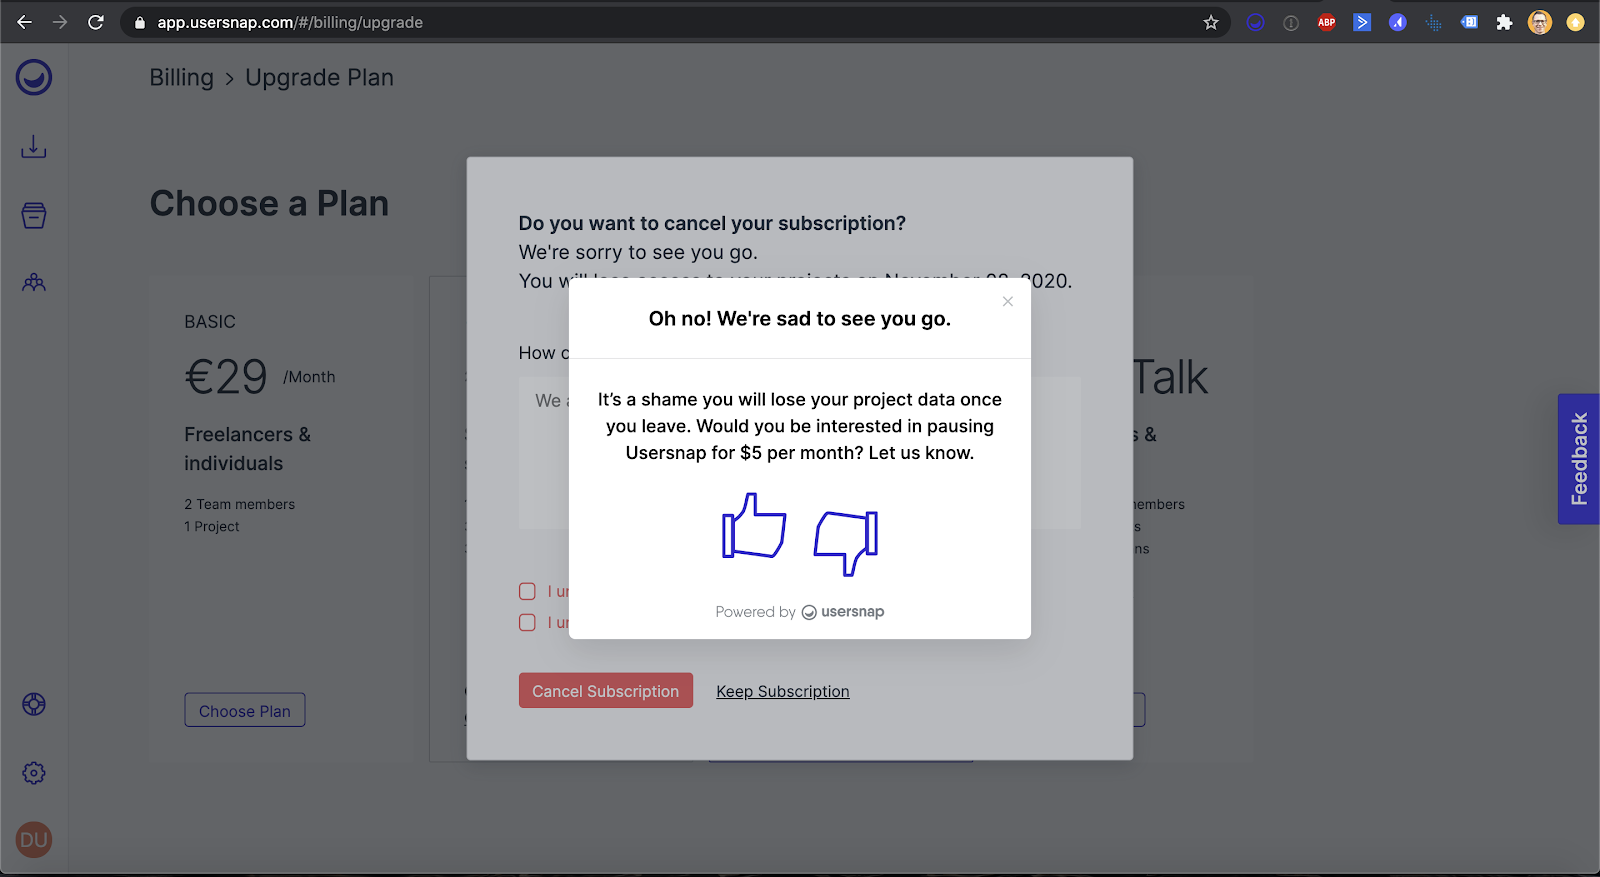
We designed a survey that told customers that we’re sorry to see them go and asked them about the reason they were leaving us.
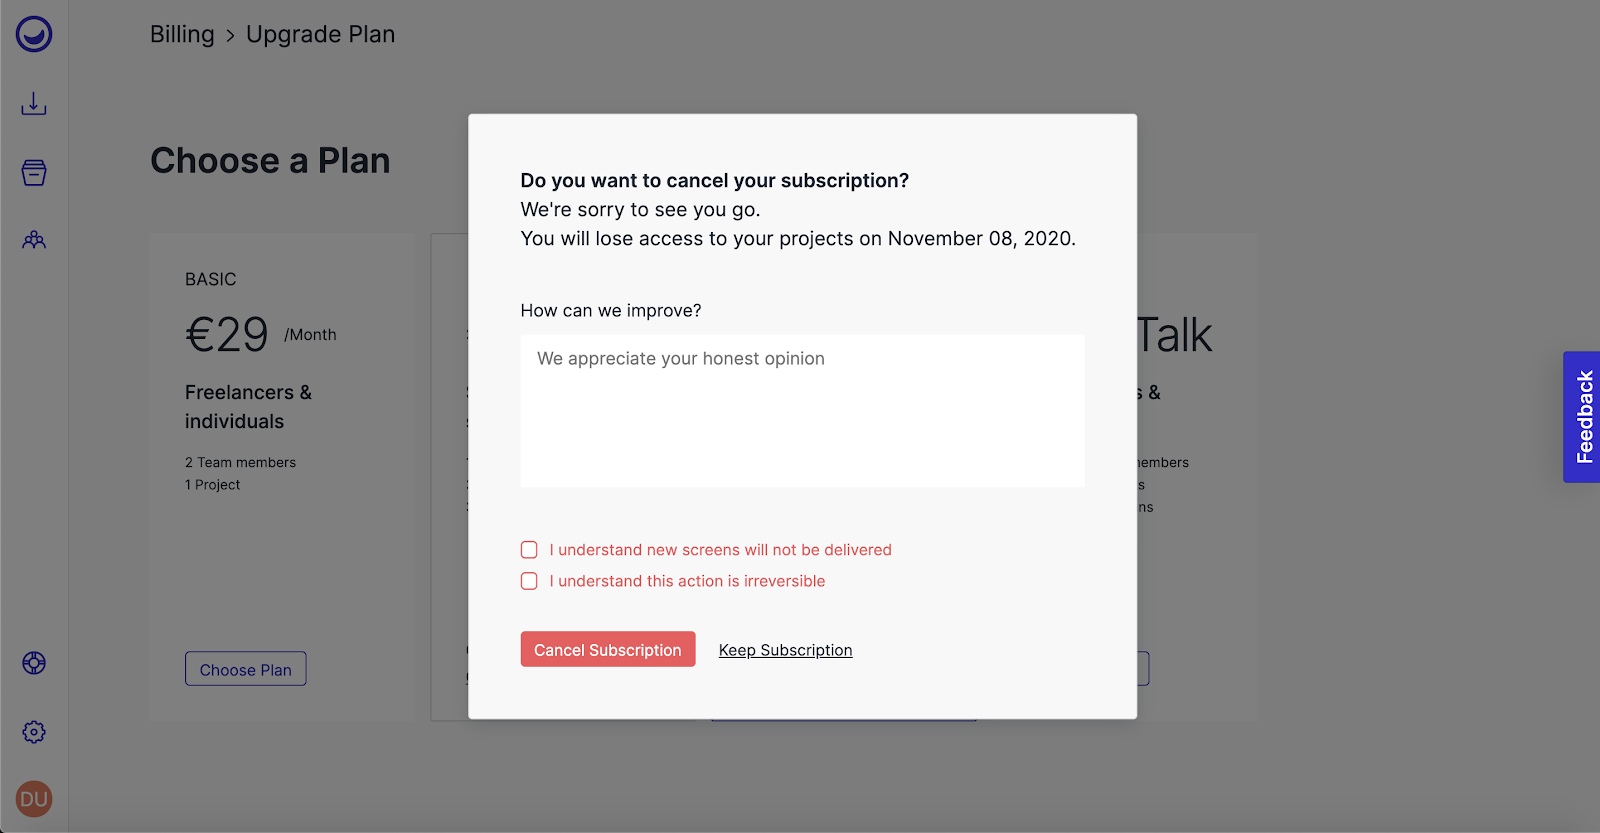
Since customers don’t have any further interaction with the business or they’ve gotten frustrated by something in the product, they are more willing to shout out why they are leaving (sometimes from the rooftops).
This strategy allowed us to learn more about our business as a whole, and what we could do better.
Combining ChartMogul and Usersnap to see the full picture
Once we had sufficient quantitative data, using the ChartMogul dashboard and direct qualitative feedback from our paying customers, it was time to combine them to identify the primary root causes of churn.
Using qualitative and quantitative data in tandem allows you to determine the ‘what’ and ‘why’ simultaneously. For us, this brought about that additional “oomph” to better understand our churn situation, and devise an adequate strategy.
What did we find?
The first thing we calculated was our average churn rate automatically in ChartMogul. Compared to the industry average of SaaS at around 5%, ours was a bit high.
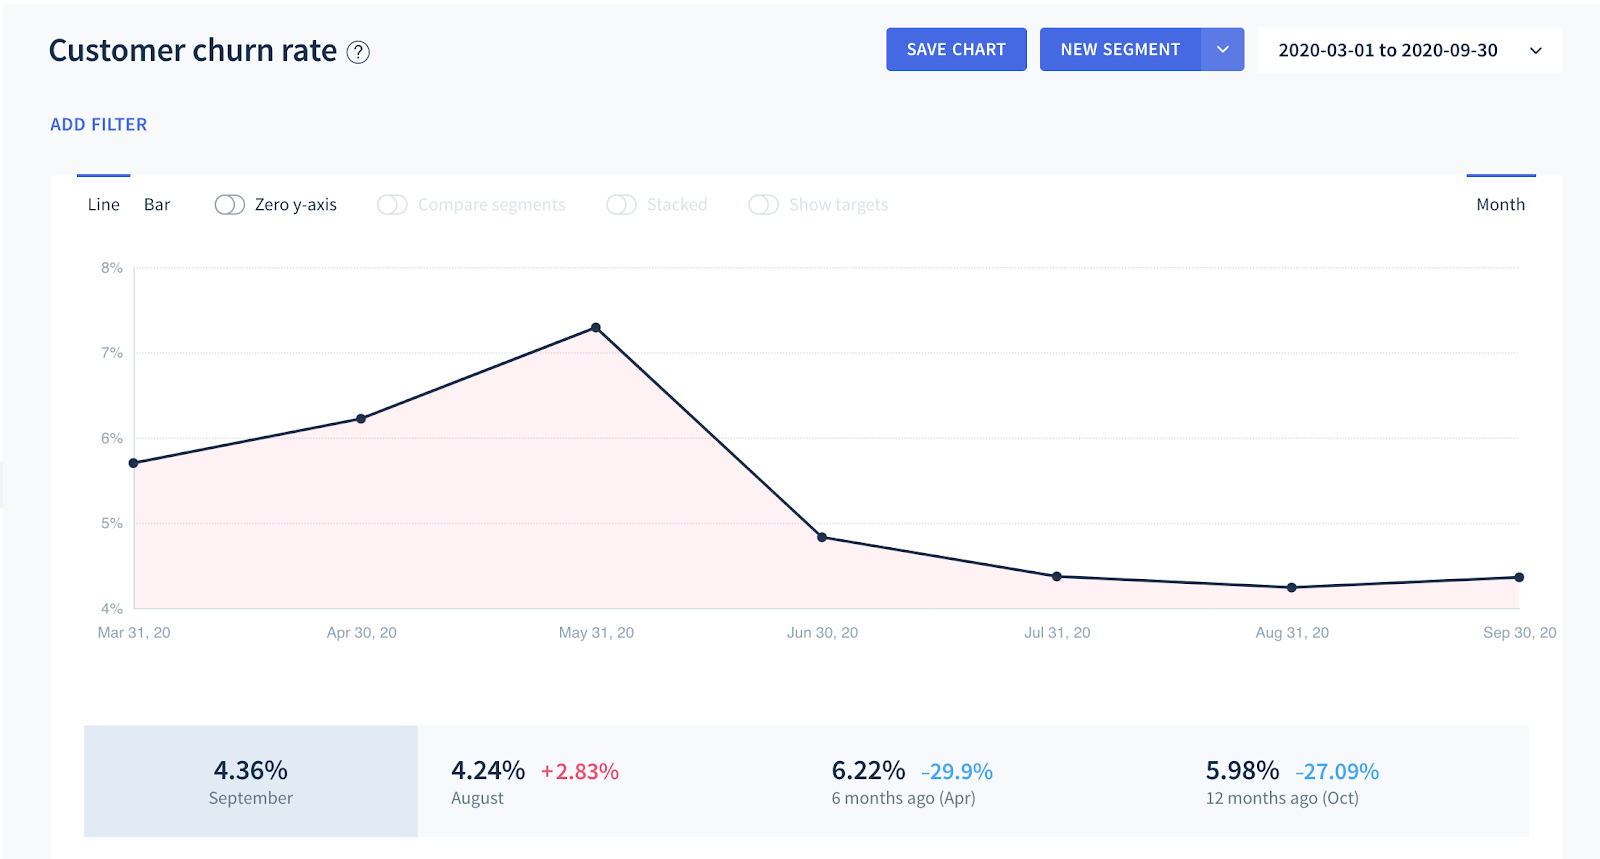
We went through hundreds of feedback items from our customers, and we were able to figure out the issue was inherent to our system. We did this by categorizing our customer churn feedback in Usersnap based on the feedback our ex-customers gave us.
Our business strategy was designed in such a way that it was not conducive to retain customers. Since we provide a product used for QA and visual bug tracking, which is more often than not project-based, customers would leave as soon as the project was over. So even if customers were leaving, it wasn’t because they wanted to throw tomatoes at our product, and a pie in our faces. They are indeed known as our “happy churners”.
In total, we realized that this project-based churn figure accounted for around half of our entire churns on a monthly basis. This is mind-blowing for any company looking to figure out ways to keep customers happy, evolve, and provide new offers to keep them on-board.
Making the shift to a full customer feedback platform
We had to come up with a more practical approach, offering products that enable us to retain our customers and cut down the churn rate. It took a lot of brainstorming and evaluation of data, but we were finally able to make better choices.
We listened to our customers who gave us feedback on what they’d like to see more of. Besides the feedback collectors discussed above, we also asked our customers to tell us about features they’d like to see. We realized we could take feedback that was thoroughly described and frequent, and make it fully actionable (by building something for customers that they’d like).
By realizing that our QA specialty is project-oriented and thus has a definitive end, we evolved into customer feedback, which is more open-ended and thus increases LTV and retention. We built new use cases and features to address the needs of our current and future customers.
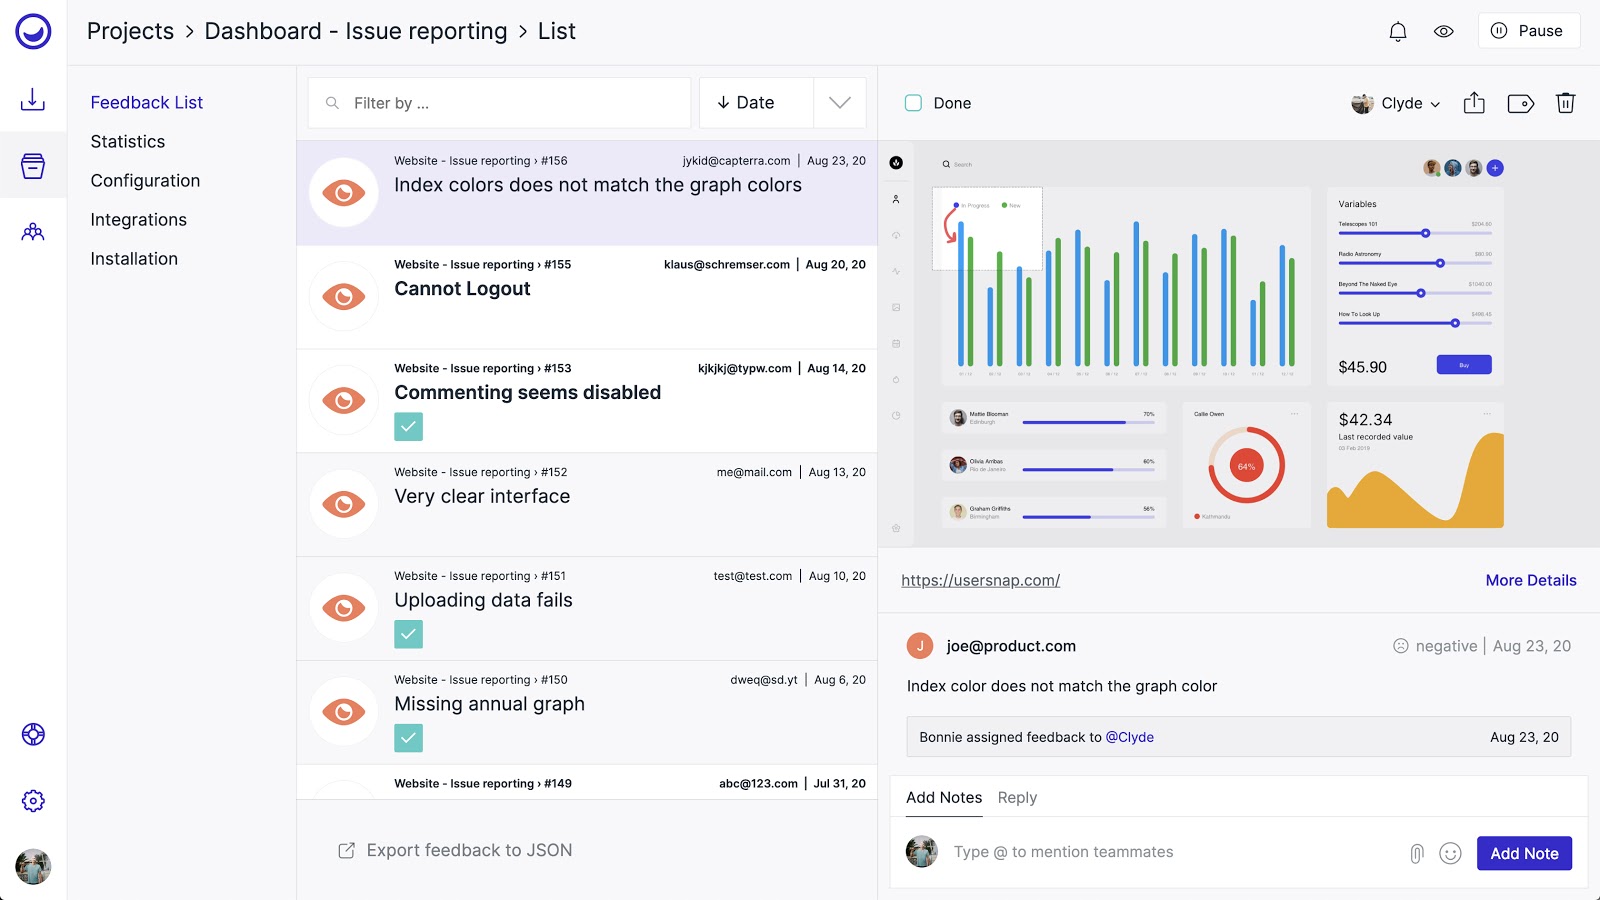
The culmination of our churn analytics and feedback review helped create the Usersnap Platform, which created a home for all of our use cases (CX and QA). This opened up the possibilities to our customers to see the value we can bring across many of their business needs, and ultimately reduce churn over a long-term period.
Churn Analytics + Customer Feedback = Clarity
A lot of businesses (like us) can struggle with retaining customers, or even understanding why they’re leaving in the first place. Implementing a multi-prong strategy, which can position your enterprise to collect customer feedback (quantitative and qualitative) allows for the right product evolution on behalf of your customers.
In our situation, we used ChartMogul to identify all of our billing metrics, and specifically churn analytics, to help get to the heart of a pain we encountered: why were customers leaving us? This, combined with asking our customers to tell us why they were leaving, uncovered new insights that allowed us to gain clarity and take action. Then, we relied on Usersnap to collect necessary customer feedback, and evolved our offerings to be able to better meet their needs with our Usersnap Platform.
Certainly, churn is a constant challenge for every company. However, with a holistic overview and approach that shows us the “what” and the “why” concerning churn, we’re able to make products that our customers love, enabling them to do the same for their customers too.
About the author:
Klaus-M. is a growth-driven entrepreneur and built growth and sales teams for various companies and startups. He co-founded two martech companies that were acquired – Gentics (by APA) and Wikidocs (by Atlassian). Klaus-M. focuses on growth of Usersnap and on customer research. He’s an enthusiastic triathlete and an advocate for lifelong learning (having also written a bestselling book).
