
The trickiest SaaS metric, for good reason
Have you ever seen the metric Customer Lifetime Value (LTV) mentioned somewhere, and wondered how exactly the final number was reached? Has an investor ever asked you to include LTV in a report or pitch, only for you to spend far too long pondering the best formula to use for your business?
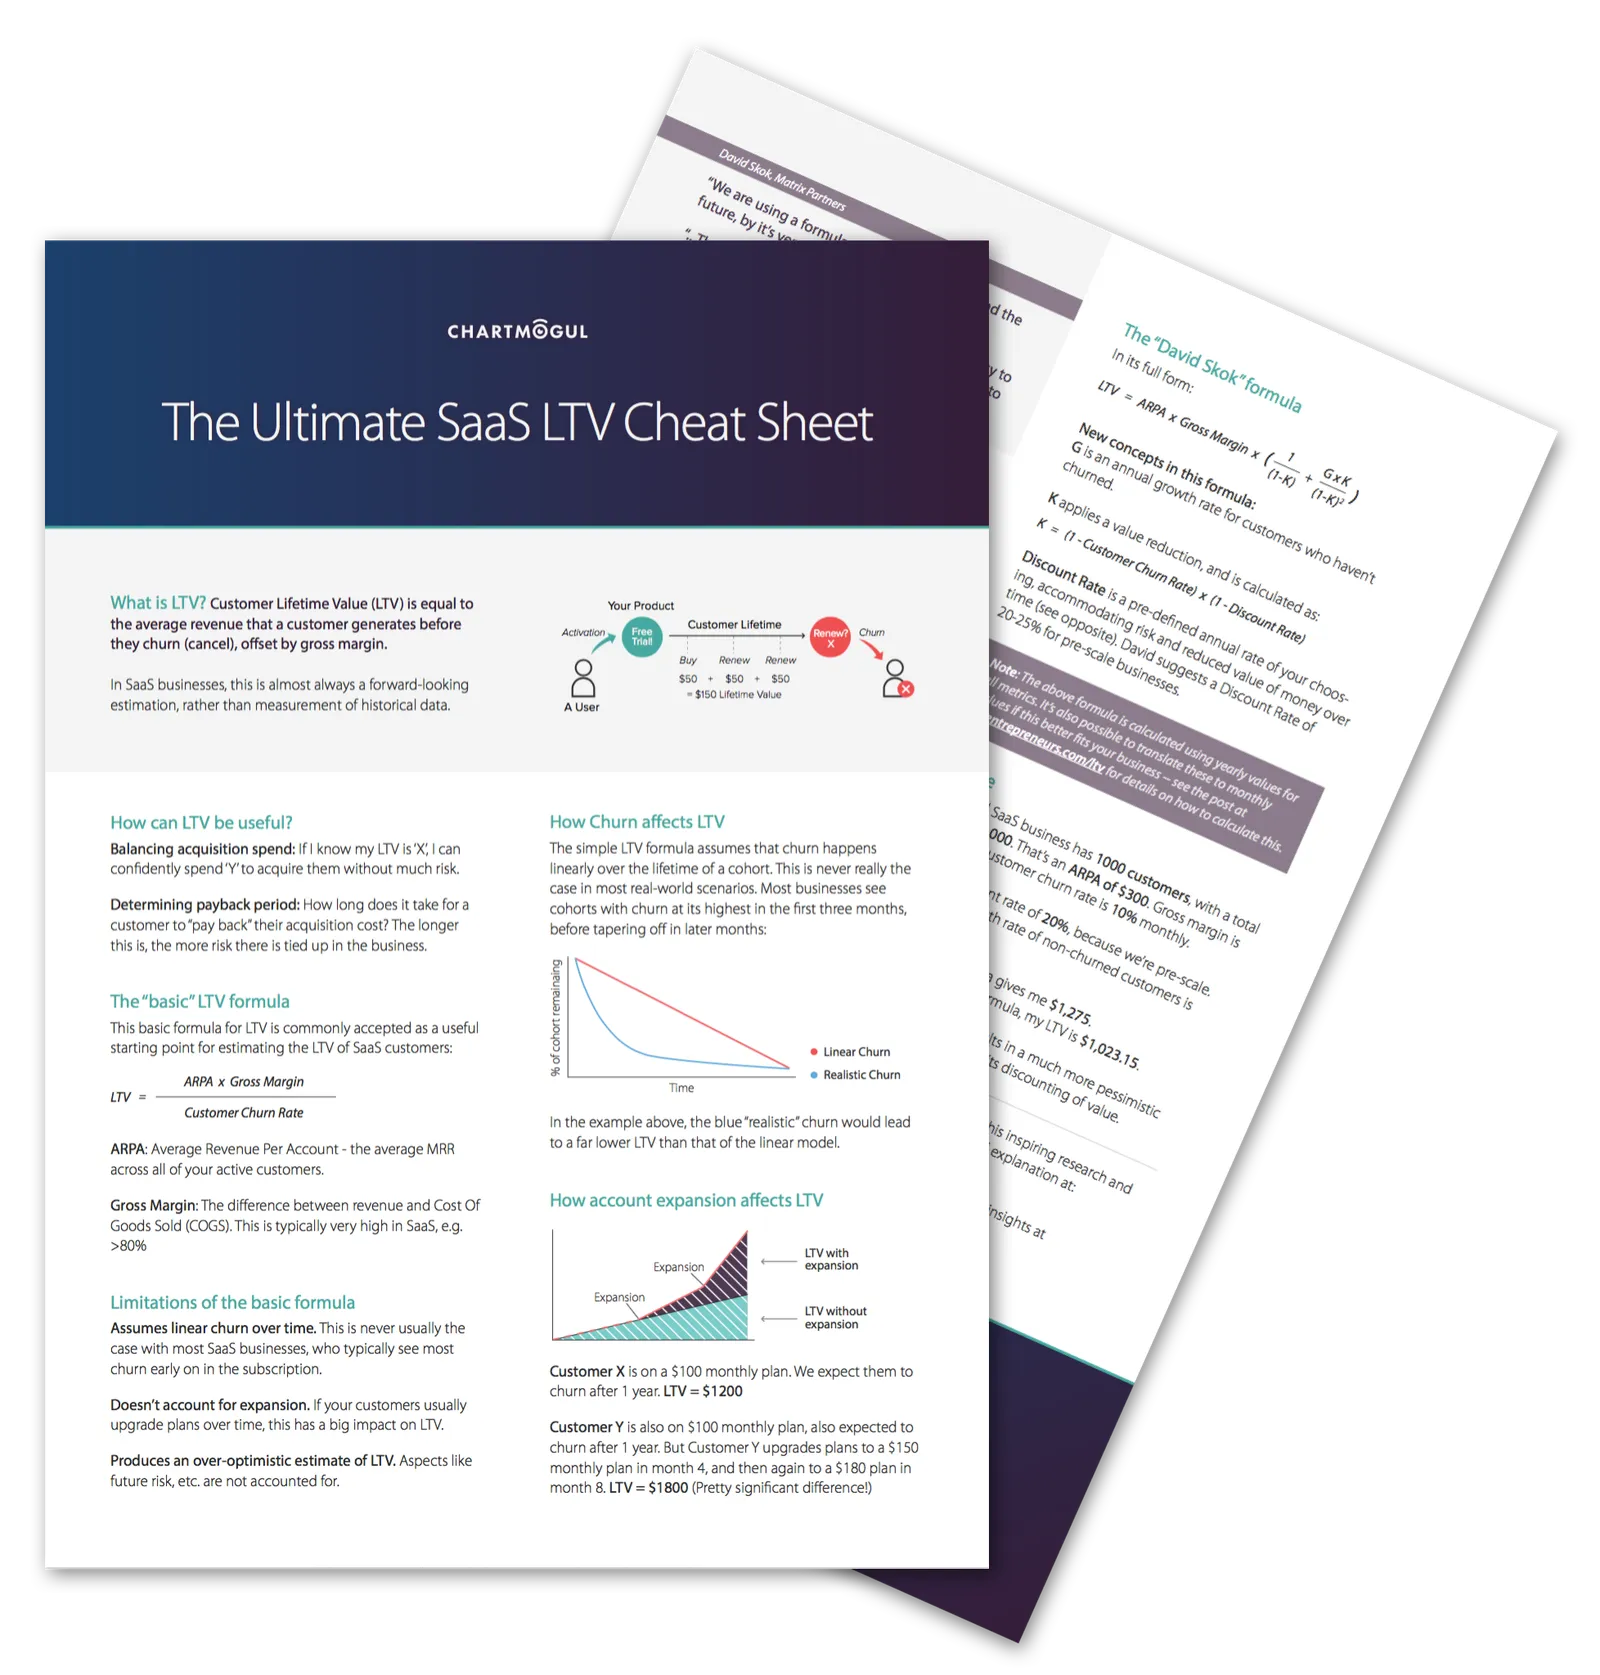
We've researched what all of the VCs and thought leaders in the SaaS space are currently saying on the topic of LTV, and put together this free cheat sheet for you to use as a reference. The cheat sheet covers:
- Definition: What really isLTV?
- The most widely-accepted LTV formula (and its limitations)
- Business characteristics that impact LTV
- A more advanced LTV formula, recently proposed by SaaS metrics grandmaster David Skok
Grab your free PDF download below.
If you find it useful, please share it with others who could also benefit from it, using the social icons to your left or the tweet below.
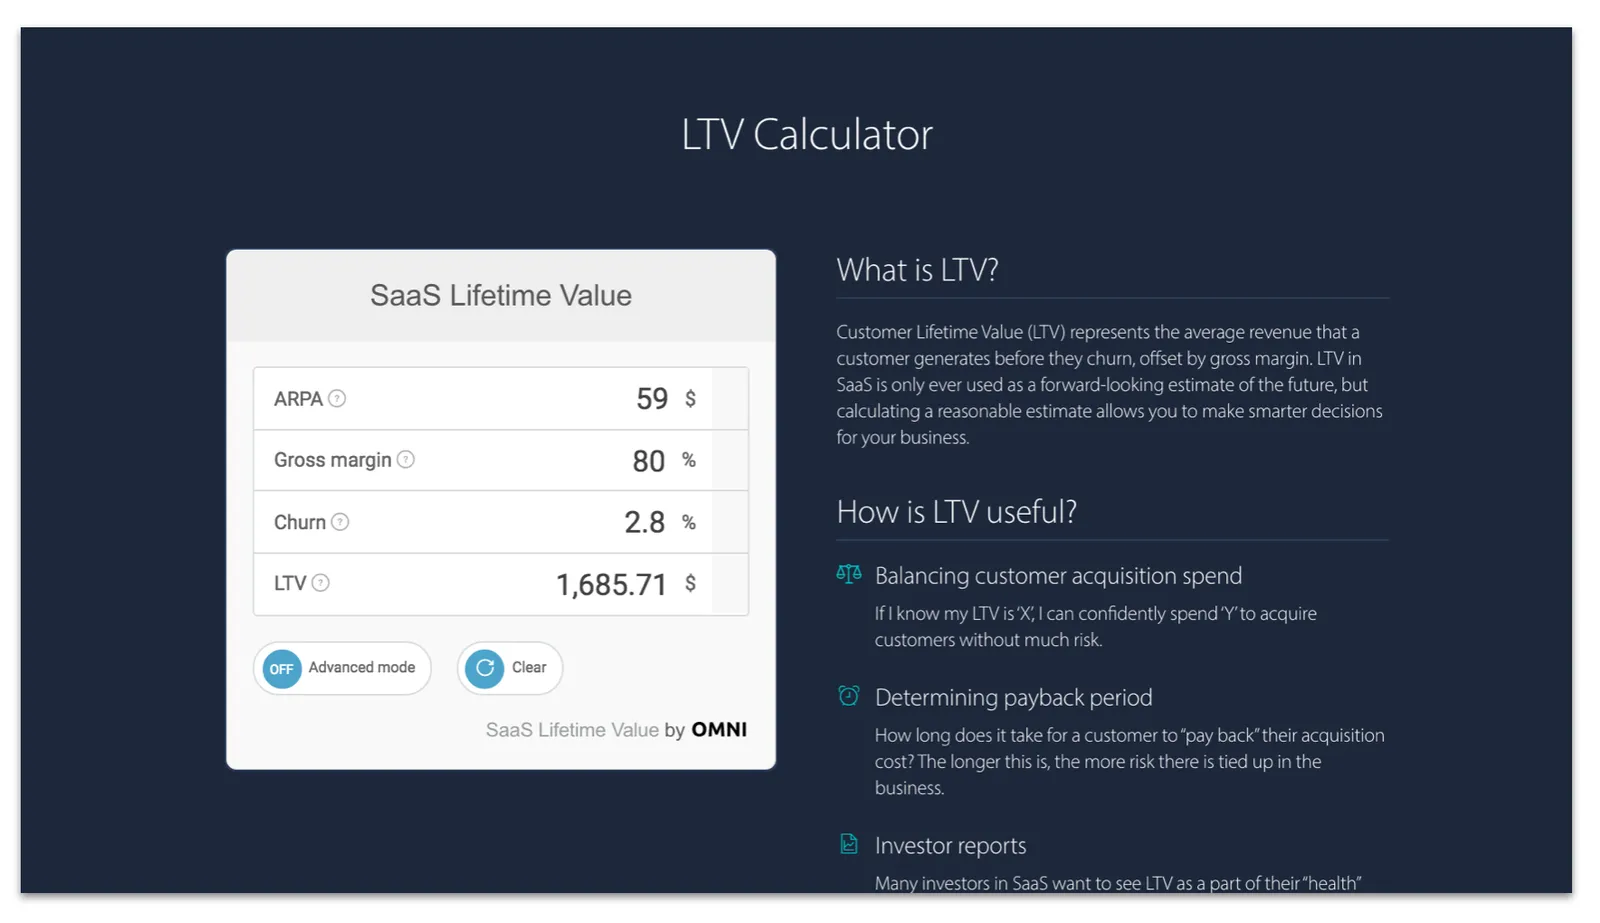
Find the LTV of your customers with our free LTV Calculator
Wait, there's more! We also partnered with OmniCalculator to launch a SaaS Calculator tool to accompany the cheat sheet. With it, you can plug in numbers and instantly get an LTV estimate. Head on over to the calculator page to give it a try:
NEW: The Ultimate SaaS LTV Cheat Sheet - Download the free PDF https://t.co/eKlcrfsKlV #SaaS pic.twitter.com/AHHkNWUzio — ChartMogul (@ChartMogul)May 19, 2016