
At ChartMogul, we have a unique view of the SaaS industry’s performance based on aggregated and anonymized subscription data. Over the past two years, we’ve shared insights on this data through the SaaS Retention Report, SaaS Growth Report and flagship SaaS Benchmarks Report.
We’ve had a hugely positive reaction, and have received countless messages like this:
Thanks for the report - it’s incredibly useful. Can you build these benchmarks right into your product? It would be really helpful for us to see how we’re doing against the average within the product itself — ChartMogul Customer, October 2023
Today, we’re launching ChartMogul Benchmarks, an on-demand and up-to-date snapshot of what good growth looks like for SaaS companies, allowing you to overlay your own performance and compare it with the rest of the industry.
See What Good Truly Looks Like
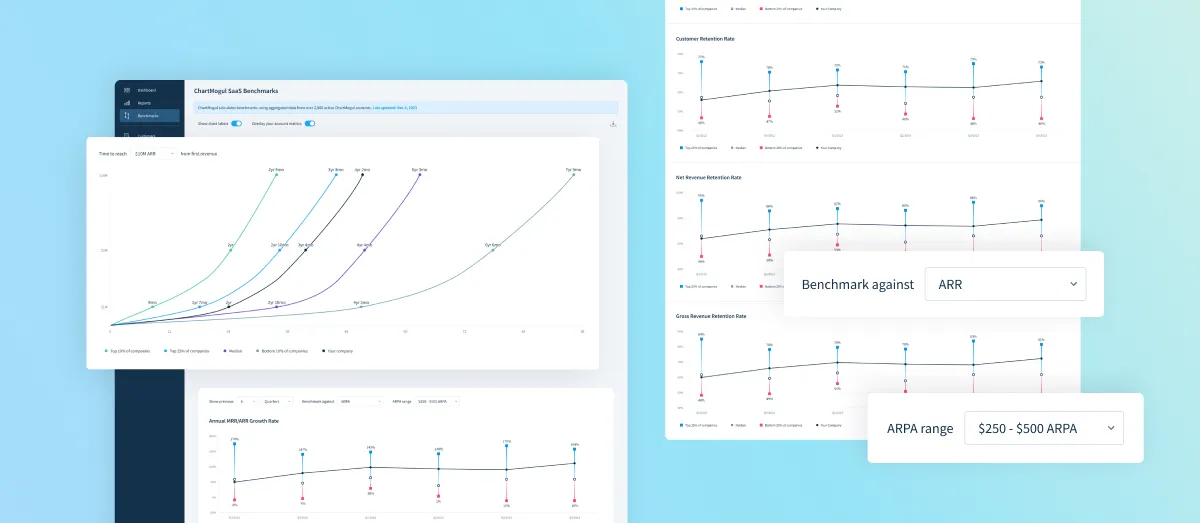
Benchmarks provides on-demand answers to:
- How long does it take companies to hit $1M, $10M, and $20M ARR?
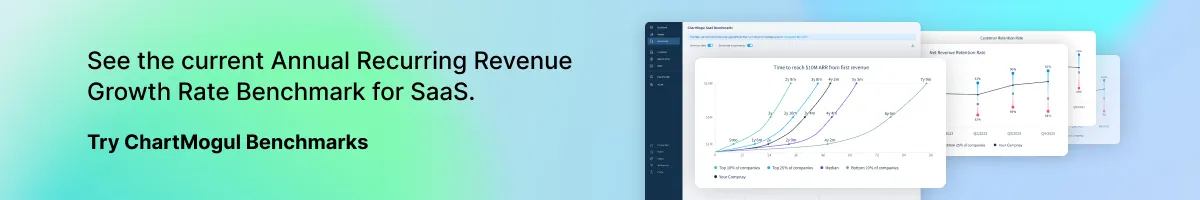
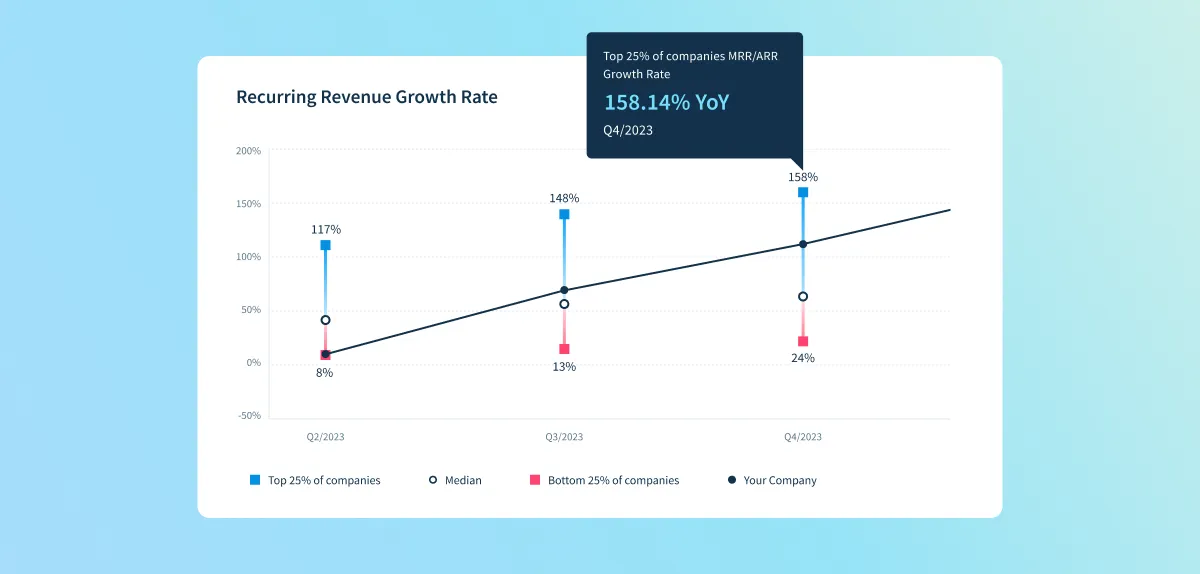
- What’s the overall annual recurring revenue growth rate benchmark, sliced by ARR or ARPA segment?
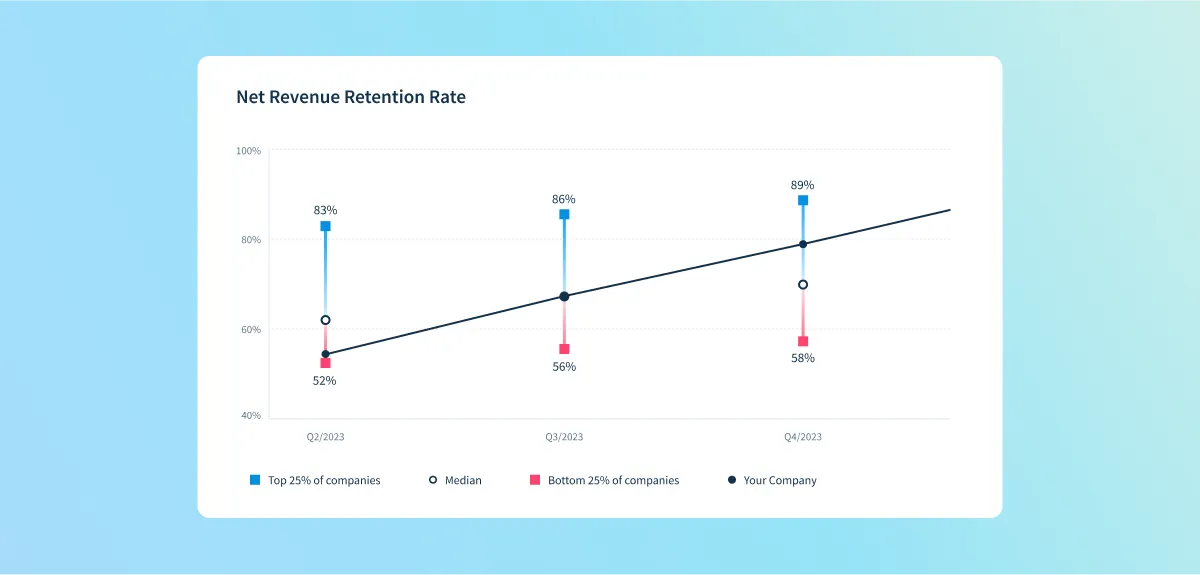
- What’s the benchmark for customer retention rate, net revenue retention rate, and gross revenue retention rate this month?
- Which quartile you’re in, by overlaying your own company’s performance on top of benchmarks.
ChartMogul Benchmarks are calculated using real revenue data, not hearsay, watercooler chat or surveys. When comparing your company's performance, you’re looking at factual benchmarks of statistical significance based on data aggregated from a sample size of over 2,500 SaaS companies from around the world.
Inspire Confidence Amongst your Team and Supporters
If you’re a ChartMogul Subscription Analytics customer, you can overlay your metrics on top of Benchmarks. Compare your performance to the benchmark with an added layer of context by drilling down by ARR or ARPA range. This helps your team identify your strengths, if you’re improving over time, and where there is room for growth.
Use these charts to share context with the team, board and prospective investors by sharing a credible story about your company’s progress. Export them with metrics overlay and add them to slides, emails, share in Slack or on social media.
We’ve already seen founders use benchmarks in a variety of ways including:
- Town hall meetings where they provide a higher-level view of company performance to those who might not have industry context.
- Board meeting slides where they anchor your performance to companies in a similar growth phase, and give context to your goals.
- Investor pitch decks where they quickly demonstrate your key strengths, speed, and competitive edge.
Validate Strategic Plans and Priorities
ChartMogul Subscription Analytics allows you to track your performance over time, and now with Benchmarks, you can contextualize this by comparing your performance to your peers.
Benchmarks are updated during the first couple of days of each month, so you can keep your finger on the pulse of the industry, and track how your performance stacks up over time. This helps you understand how much market headwinds or tailwinds are impacting your performance, and quickly see areas where you’re bucking the trend. This is valuable insight for strategists trying to spot how and where your well-executed plans are driving true performance, and how you’re building competitive advantage over time.
ChartMogul Benchmarks are available to all users and ready for you to analyze. Get started by logging into ChartMogul today, and subscribe to the SaaS Roundup to be notified when the new monthly update is out.