
At ChartMogul, we believe in data literacy as a core component of any healthy business. We’ll be covering the topic in a number of ways over the next few weeks. Stay tuned for resources and guidance, including data vis input from industry experts!
Don't forget to sign up to our SaaS Roundup newsletter to make sure you get the latest articles from us.
I remember being taught some form of data literacy at primary school (around age nine).
We started to learn about how you could represent numbers with things like charts to show the relationship between different groups of data. Drawing a bar chart to compare the number of kids in class who like bananas to the number of kids who like apples — you get the idea. For the record, I was fully in the banana camp. 🍌
For years, modern businesses have used data and metrics in almost every decision they make. If you want to argue for more budget for your particular project, you’d better have some data to back up your reasoning.
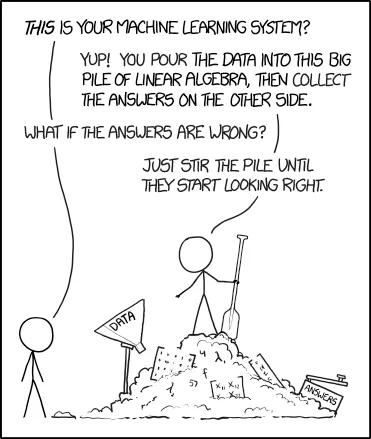
But more recently, the use of data shifted. Technology companies started to implement Machine Learning and AI algorithms in tech products, to find highly optimized solutions to big problems humans weren’t so good at. Machine Learning methods are by nature incredibly hungry for data — they require training on huge datasets to be effective, and there’s really no limit to what they can consume. The more data, the better.
At this limitless scale, and with this technology, you can see why people are hailing data as the “new currency”.
Why not just measure everything?
Fuelling this change even more, our ability to generate and gather data has increased greatly with the advent of the “Internet of Things”, always-on mobile broadband, and smartphones carrying more sensors than we’d ever dreamed of 20 years ago. Data storage is also ridiculously cheap, so why not gather all the data we can — even if there’s no immediate use for it?
For professionals, there’s no escaping the numbers and statistics present in our working day, regardless of your role — Marketers, Salespeople, Engineers, etc. — these people all use data to make decisions and do their everyday work.
So we are all surrounded by data. But are we equipped with the skills and knowledge required to make sense of it? Secondly, do the people using such data for storytelling have adequate skills for effectively communicating and visualizing data for their audience?
Read more on data-driven culture in our article The Quantified SaaS:
The dream of democratized data
A recent article in Forbes stated the following:
“Data in the hands of a few data experts can be powerful but data at the fingertips of many is truly transformational.”
Which hints at the true potential of democratized data in business. If we really can empower everyone to gather, interpret and use data to their advantage, the benefits promise to be huge.
In the Enterprise sector, the dream is just as compelling (perhaps unless you’re a data scientist): Kissing goodbye to the standalone BI team, and democratizing access to data that was at one point locked away behind layers of complex queries or software that required months of training. The death of the data warehouse is a welcome change in many agile fast-growing businesses.
However, in the same Forbes article is the following statement:
“The data literacy divide will impede organizations from reaping higher rewards from their data investments.”
And here we reach the crux of the problem: Unlocking the power of data requires not only advanced technology but well-informed, data-literate people. And that’s where the gap is growing.
What’s holding us back?
Spoiler: It’s not the technology.
To understand where we’re lacking, it’s worth clarifying what we mean by “data literacy”. There are a few different definitions, but here’s a simple one from Margaret Rouse of whatis.com:
“Data literacy is the ability to derive meaningful information from data, just as literacy in general is the ability to derive information from the written word.”
She goes on to describe the skills defining data literate people:
- Knowing what data is appropriate to use for a particular purpose.
- Interpreting data visualizations, such as graphs and charts.
- Thinking critically about information yielded by data analysis.
- Understanding data analytics tools and methods and when and where to use them.
- Recognizing when data is being misrepresented or used misleadingly.
- Communicating information about data to people lacking data literacy, an ability sometimes referred to as data storytelling.
Every one of the above skills is used in businesses many times per day. We communicate in data, make decisions based on data, market ourselves with data. To lack these skills is to present a fundamental risk to information-driven businesses.
The gap is growing
There’s another problem. The rate at which the size and complexity of data sets used in business is growing far outpaces our rate of improvement at understanding such data. Big data moves us into the realm of numbers with more zeros than we’ve ever considered, let alone interpreted or analyzed. In other words, humans are becoming increasingly alienated from the technology they’ve helped to create, as our brains struggle to comprehend the latest concepts.
That leaves just the PhD-level graduates who can truly work with such scale and complexity — individuals who are highly valuable, but rare and out of reach of many young businesses and startups.
What can businesses do to address this?
Firstly, as with so many company-wide initiatives, change is incredibly difficult without buy-in from the management level. Just as with efforts related to culture in the workplace, ethics or company vision, the management team needs to be fully onboard.
Drive awareness of core skills
Businesses can start with educating on the simple, practical skills required to use data in the workplace, including:
- What’s the best way to visualize this raw data?
- What story is this data visualization telling me?
- What’s the source of the data in this chart I’m looking at?
- Is this data biased in some way?
- Am I biased in some social or cognitive way, when I’m looking at this?
Empower employees with the right tools
Fortunately for us, there are a number of entrepreneurs out there who’ve made it their mission to tackle the issue of data literacy in business. The resulting products leverage data in such a way that it’s accessible to the entire company — rather than just the technical, data science or BI teams. Here are a few:
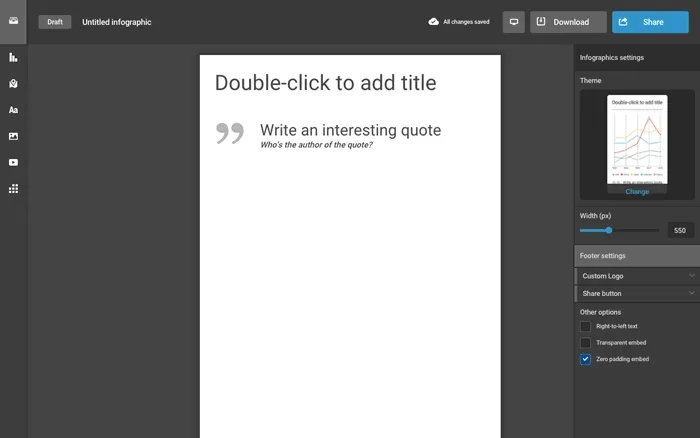
Infogram makes it easy for anyone to make infographics and charts to tell stories about data:
Infogram Founder Uldis Leiterts has even given a TEDx talk on “The age of data literacy”. You can watch it here.
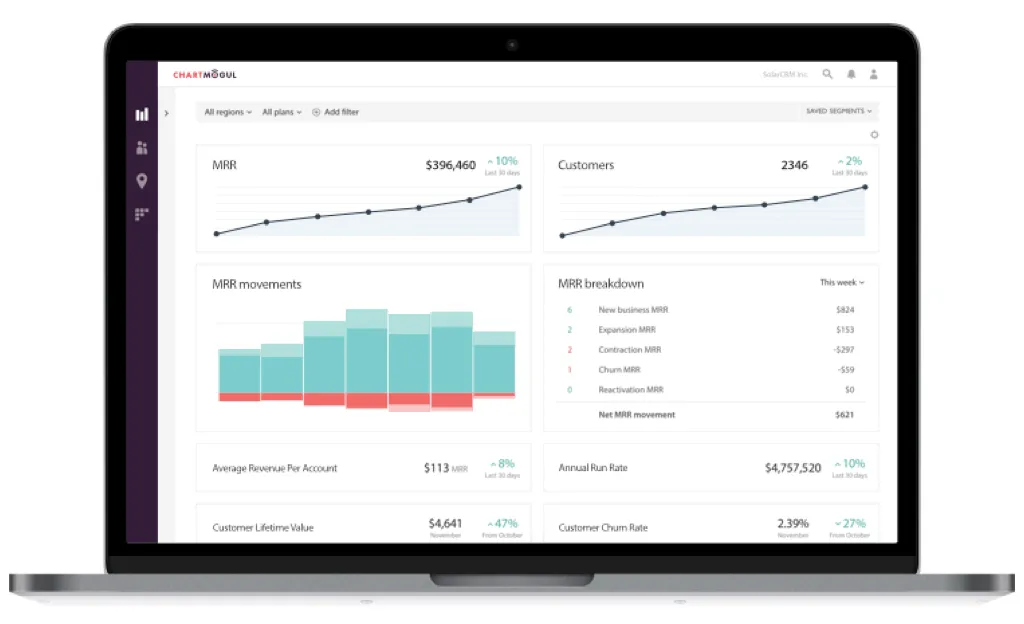
ChartMogul (that’s us!) is used by people in almost every role across subscription businesses, to understand customers and make informed decisions.
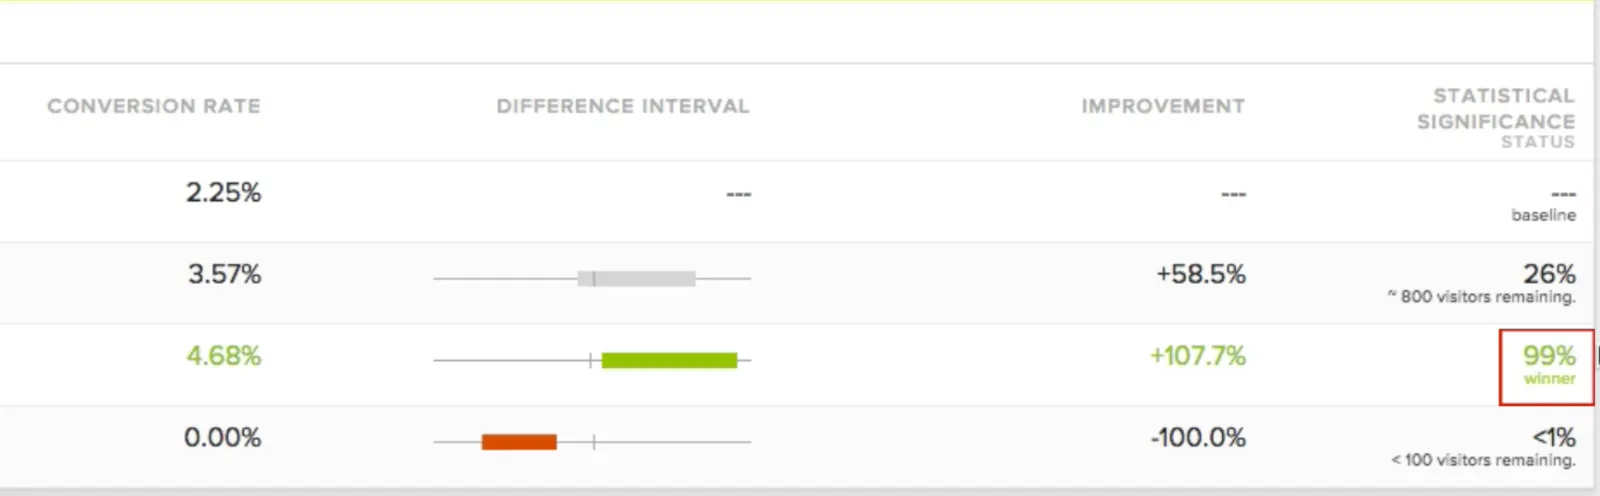
Optimizely does a great job of educating its users on understanding the statistical data behind running experiments. Concepts like Statistical Significance are complex, but clearly explained in Optimizely’s product and documentation:
Google does a lot of work to foster data literacy. Obviously tools like Google Analytics come to mind right away, but the company recently launched a micro tool to help storytellers show the relationship between two entities in a visual way, called Data Gif Maker.
Anyone can quickly use Data Gif Maker to input data and receive a simple animated GIF to use in their content:

Towards a data literate future
“Data literacy is built upon data democratization and the user experience. If a platform is difficult, it won’t be used. If a platform doesn’t serve all teams equally well, it will not be adopted across the organization. If a platform isn't architected to bridge the gap between regular people and the data scientists creating the algorithms, then the era of data-driven anything will fail to materialize.” ~ H.O. Maycotte, Forbes
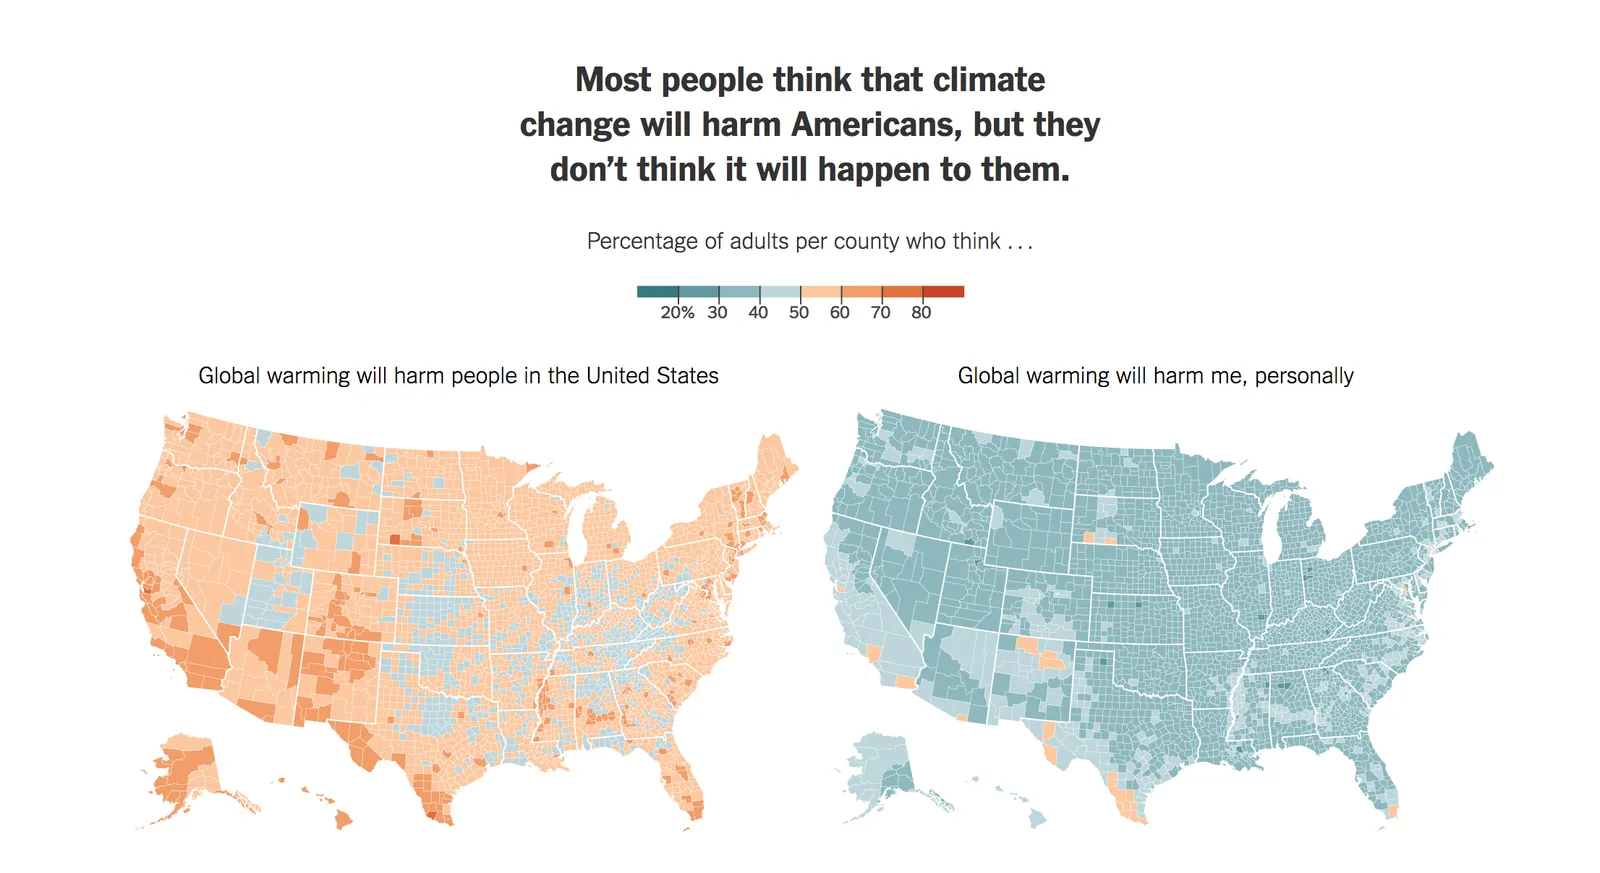
Today, we live in a sort of “Wild West”, where the quality and validity of data storytelling online varies massively. Some outlets and news publications put a lot of effort into accessible data visualization that connects with people and conveys the facts in a compelling way:
Unfortunately, in other cases publications seem to be out to use data to manipulate the population, through poorly-visualized data and clear bias:

As Infogram founder Uldis Leiterts highlighted in his TEDx talk, the world has an 85% literacy rate (that’s literacy, as in, people who can read).
Given the rise of data as the lifeblood of our communication in business, journalism and everyday life, it’s probably time for us to reach towards an 85% data literacy rate too.