As the year comes to an end, we at ChartMogul always like to pause and reflect on our journey over the past 12 months. It has kind of evolved into a tradition.
Reflections help us look back on what we have accomplished and what’s next in our journey. So let’s dive in.
What’s new in ChartMogul in 2021?
ChartMogul is a product-led company. Our mission is to build the world’s most powerful subscription analytics platform for the SaaS community. We remain committed to that.
Building the leading subscriptions analytics platform means listening to our customers, and implementing changes to the product that bring them the most value. With that goal, this year, we launched several product improvements including:
An Android app + an updated iOS app
We live in a mobile-first era. And we know how important it is for you to be able to track your metrics on the move. That is why in addition to upgrading our iOS app this year, we also launched our Android app. Both the apps now let you and your team log in easily via QR codes. They also have a VC feature that lets you track metrics for multiple ChartMogul accounts at once. In the iOS version, you can also add a permanent widget to your home screen.

7 new or upgraded billing system integrations
Importing your billing systems data into ChartMogul has never been as easy as it is now. With just 1-click you are now able to import data from 22 integrations that we and our partners maintain. We added/upgraded 7 of those billing integrations this year:
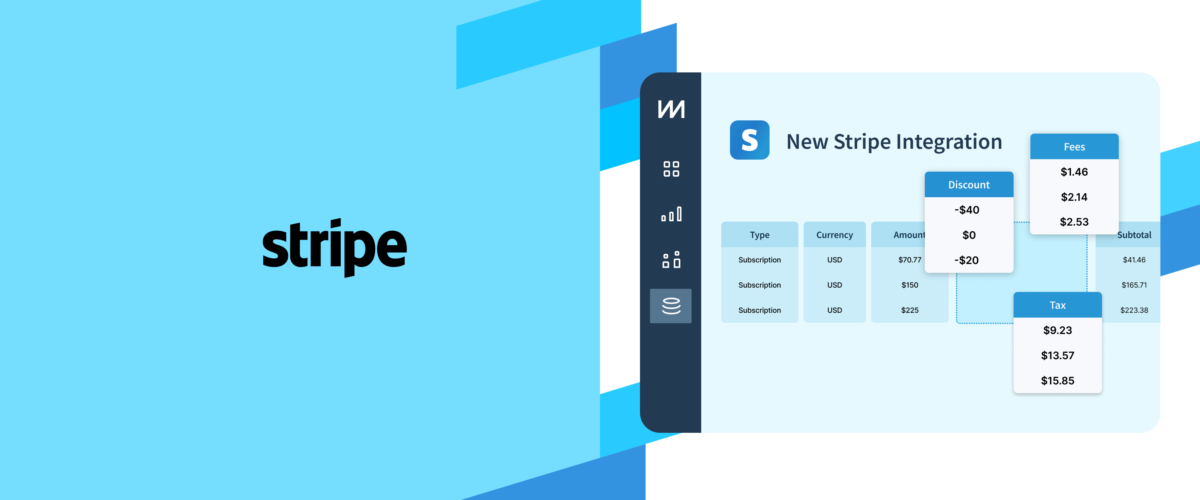
- Stripe — added the ability to recognize open invoices to your MRR; grouped multiple add-ons/linked subscriptions from the same customer under one single umbrella (vs showing as different subscriptions before), and increased transparency by allowing you to audit your billing data within ChartMogul’s Data Platform. You can read the full release announcement here.
- Google Play — added a new one-click import functionality (vs previous integration that required development work).
- PayPal — improved our integration to handle edge cases when ChartMogul received the notification but the transaction wasn’t available yet in the PayPal API, and we also added support for PayPal Subscription API.
- Recurly — optimized the performance of historical data imports.
- Chargify — launched a new integration in partnership with SaaSync. The new integration now lets you audit your billing data within ChartMogul’s Data Platform. We also added support for relationship invoicing, recurring components, cancellations, discounts, differential pricing, and the option to exclude tax from your MRR calculations.
- QuickBooks — added QuickBooks as a new billing system integration, in partnership with SaaSync.
- Xero — added Xero as a new billing system integration as well, again in partnership with SaaSync.
In addition to the above, this year, we made importing data via user interface (UI) more robust. We also improved the performance of CSV imports.

New ways of exporting data out of ChartMogul
We understand that ChartMogul’s value to you comes not only from the application itself but also from the data we provide. We continue to work hard to make it easier for you to export data out of ChartMogul. This year, we added:
- New API export endpoints — added/upgraded endpoints to be able to a) extract activities based on the time frame they took place and/or their type, b) create CSV exports in addition to the usual JSON, and c) retrieve account-level information (via API) such as the account’s name, currency, time zone, etc.
- New Pitch integration — added a new Pitch integration this year. You can now directly add revenue charts within Pitch without leaving the platform. The new pitch integration joins our other popular integrations with Zendesk, Geckoboard, and Zapier.
- API access management — we now allow for multiple user-level API keys (vs only having admin keys previously). We also added support for audit capabilities, including the ability to disable or delete the API keys when needed. Lastly, we improved the overall security of ChartMogul APIs. The full announcement note can be found here.
- Cloud destinations (coming soon) — we are in process of adding the ability to export your MRR movements data from ChartMogul onto the cloud. We will support exports to Amazon S3, Microsoft Azure Blob, and Google cloud storage.
You can always visit the data output page within your ChartMogul dashboard for all your export needs.

New data settings, new filters, currency fluctuations, and more…
We understand that you want to be able to tailor your metrics based on your preferences. With that in mind, we rolled out functionality to let you customize even more data settings. We also rolled out filter upgrades and support for multi-currency fluctuations.
- Universal churn settings — you now can harmonize how you recognize churn (at the time of cancellations vs at end of the service) across 4 new billing systems (Chargebee, GoCardless, Zuora, and Google Play) in addition to the existing 6 we offered historically (Stripe, Braintree, Recurly, Chargify, Paypal, and ChartMogul API). Read more about this setting here.
- Exclusion of transaction fees from metrics — added the ability to exclude transaction fees from your MRR and cash flow calculations.
- New filter upgrades — added smart plan groups which automatically group your monthly, quarterly, and annual plans to help better segment your charts. We also added the ability to filter via “is present operator” and “is at least one of” logic within our filters. Lastly, we added dynamic time ranges to our filters for you to be able to quickly select a predefined range (eg. last week, month, or quarter) to segment your customers.
- Currency fluctuations — we now show you the impact of currency fluctuations on your MRR in a separate row in our data tables for greater transparency.
- Linked subscriptions — introduced linked subscriptions i.e. changes to a single customer’s subscriptions in quick succession are classified as expansion or contraction activity, instead of a churn and reactivation.
- Customized timeframes for cohorts — added the ability to let you select customized timeframes when analyzing your cohorts. We also now let you select your preferred calculation methodology i.e. cohorts that calculate metrics using starting of the month methodology vs last month.

Many quality of life improvements
Last but not the least, we made many improvements to make your experience of using ChartMogul even more pleasant.
- Improved performance — made enhancements that now make charts load 30% faster; improved the loading time of customer lists and added cache facility to the custom attributes manager. These improvements primarily target accounts that have a high volume of data.
- Local map colors — we now recalibrate map’s heatmap colors if you are viewing data for the USA at the state level.
- Added Net ARR movement — added net ARR movement numbers to some chart data tables.
- Design updates — simplified our dashboard layout (moved top header to the left), updated the design for our data tables; and refreshed our help center/developer hub layout.
- Ease of search/navigation — we now let you search through all your customers when merging them. Clicking on any external customer ID now also lets you browse through their profile in a new tab.
- QR codes — added the ability to quickly copy your newly created API keys by scanning the QR code (instead of needing to type them out on your mobile device).
This year, we also migrated ChartMogul to AWS cloud. The move was months in the making and will bring many advantages in terms of performance and scalability to our platform.
As always, you can stay updated on what’s new with our product on our blog or in our release notes.
A very high bar for customer support… as ever.
At ChartMogul, responding and resolving customer queries promptly is a top priority. Overall, in 2021, we logged and resolved 10,007 tickets with an average first response time of 20 minutes. Our overall customer satisfaction score for these queries was 97%.
To add to that, our uptime for 2021 (for both the App and the API) was an impressive 99.95%.
We hope to be always there for you :)
Our team grew to 60 strong and ChartMogul turned 7
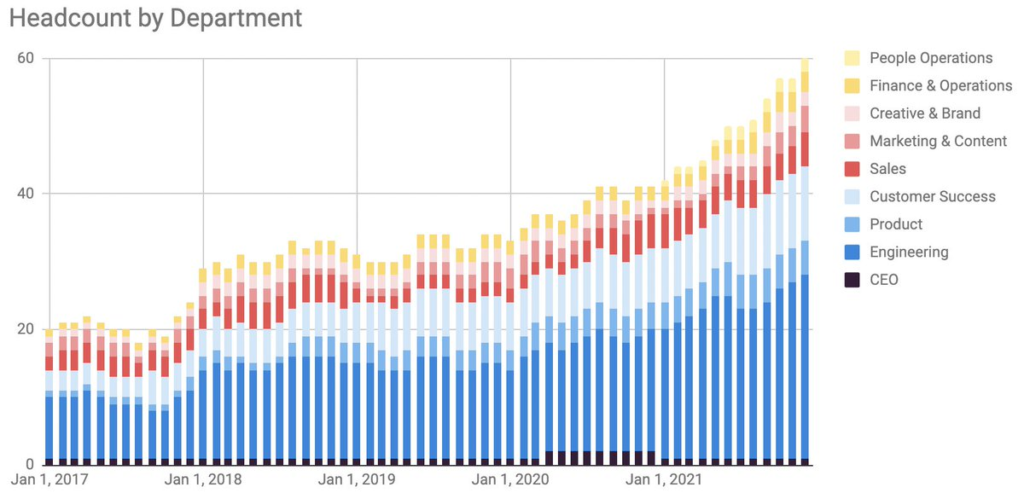
This year, we added 17 new members to our team, growing our headcount from 43 at the start of the year to 60 now (up 39% YoY). Over the past five years, our team has tripled in size (see chart below). As has always been the case, product and engineering continue to remain our key focus areas. They make up for >50% of our workforce.

This year, ChartMogul turned 7.
To thank the team for their efforts, and commemorate ChartMogul’s 7th anniversary, our CEO, Nick, hired Russ Hanneman, everyone’s favorite brilliant billionaire investor.
Our Mogul network (countries where we have employees) grew as well. It touched 21 this year. Even though we have 3 main locations (Berlin, Toronto, Seoul), we at ChartMogul operate as a distributed team. So each year, we make an extra special effort to get the team together in real life. This year, our team got together for the “Work from Berlin Week”.

We attended SaaStr, P9 offsite, and launched our community, Mogul I/O
We have attended every SaaStr Annual and SaaStock conference since its founding. This year was no exception. This September, our team got together in sunny San Mateo for SaaStr 2021 and had 3 days of amazing fun.

Conferences for us are all about meeting people in real life and building lasting connections. We even did a collaborative video with Slidebean discussing “Why Startups have booths at Trade Shows?”.
In October, we attended the P9 founder offsite and got to learn from some of the best founders out there.

This year, we also launched mogul.io, a slack-based community exclusively for SaaS Founders and CEOs with ARR between $0.5M and $50M. Currently, the community has 259 members in it. You can join it here and read more about it in our launch announcement here.
We started to build a brand… $83,334, Swag and it’s f**king ChartMogul
This year, Russ Hanneman became the unofficial brand ambassador of ChartMogul. How did it all start? With a tweet. Read more about it here.
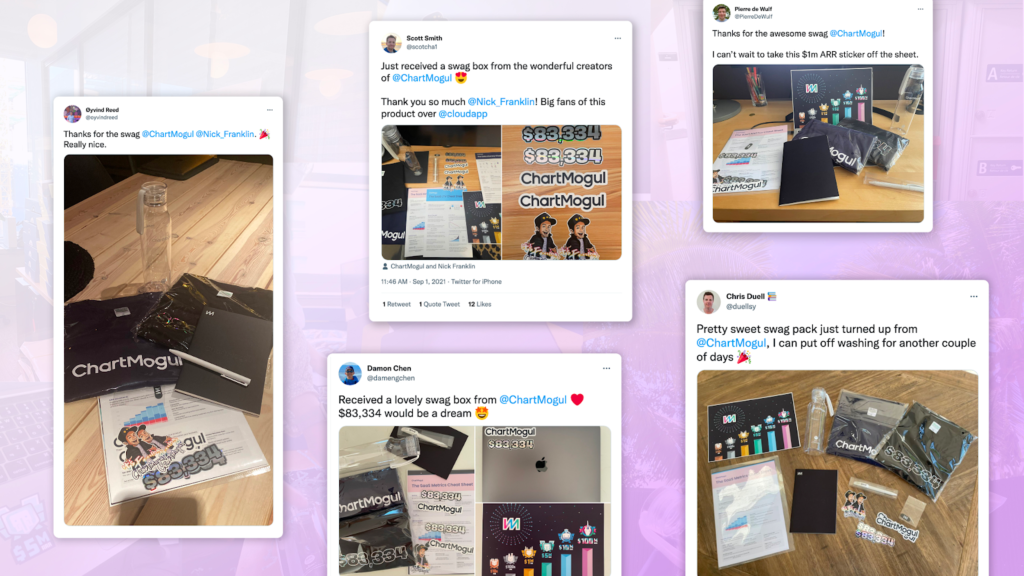
We also launched the $83,334 MRR campaign and delivered lovely ChartMogul branded swag boxes to 440 homes.

In addition, we sponsored many of SlideBean’s YouTube videos including the one on SaaS metrics: the ULTIMATE guide to Software as a Service KPIs. Their content is one of the best out there and we are proud to be their partner in this journey.
Our most popular content this year
Here is some of the most popular content that we published at ChartMogul this year.
Most popular SaaS open mic podcasts
This year, we revived our SaaS open mic podcast, with our new host Olivia Jarvis. We recorded 14 episodes in total. The 3 most popular ones were:
- Building a Company That People Root For with Andrew Gazdecki (CEO and Founder, Microacquire)
- Building Sales at a Product-led Company with Adam Jones (VP of Sales, Thinkific)
- Popmenu Secures Product Market Fit Pre-COVID, Growth Soars with Brendan Sweeney (CEO and Co-Founder, Popmenu)
Most popular blog posts
This year, we also published 24 blog posts in total (excluding podcasts and customer case studies). The 3 most popular ones were:
- What is ARR? It’s not as simple as you think by Nick Franklin (CEO & Founder, ChartMogul)
- The 2 Types of SaaS Pricing Localization (and When to Use Them) by Steph Knapp (SaaS content writer)
- How to Build a Community to Grow Your SaaS Company by Tom Bangay (Director of Content, Juro)
6 customer case-studies
We learned what it’s like to grow your business using ChartMogul with 6 customer case studies.
- How Whereby is Using Revenue Data to Conquer Freemium with Ken Carlson (Director of Finance, Whereby)
- Using ChartMogul as a Bootstrapper with Steve McLeod (Founder, Feature Upvote)
- Moving from Assumptions to Facts with John Thornton (Founder and CEO, Black Propeller)
- SignEasy Doubled Their Customer Count by Focusing on the SME Segment with Sudeep Shukla (Chief of Staff, SignEasy)
- Disciple Media Replaces Custom BI Solution to Power Recurring Revenue Growth with Frankie Feast (Financial Controller, Disciple)
- How a Strong Data Culture Underpinned a Successful Acquisition between CakeHR and Sage with Kaspars Upmanis (VP Category Leader, HR & Payroll, SageHR)
Customers are at the heart of what we do. We would like to thank them for sharing their stories with us.
A huge thank you!
So, that’s a wrap for ChartMogul 2021: Year in Review.
We would like to sign off, by saying a huge THANK YOU!
Thank you to all of our amazing customers, readers, investors, partners, and even our competitors who keep us on our toes. We couldn’t have gotten to where we are today without all of you!
We are grateful for all that we have achieved this year and excited for what’s to come in 2022.
PS: We have done these reflections for each of the past 5 years. You can find the ones from past years here – 2020, 2019, 2018, 2017, and 2016.
