We kicked off 2017 by announcing our integration with GoCardless. This allowed GoCardless customers to import their billing data to ChartMogul and start analyzing customers and revenue.
On our blog we also explored the topic of moving up market in SaaS and how businesses might tackle this without losing their soul.
February
February in the SaaS world means one thing: The SaaStr Annual conference.
This year ChartMogul hosted a SaaStr Bingo Party -- a joint event with Point Nine Capital:

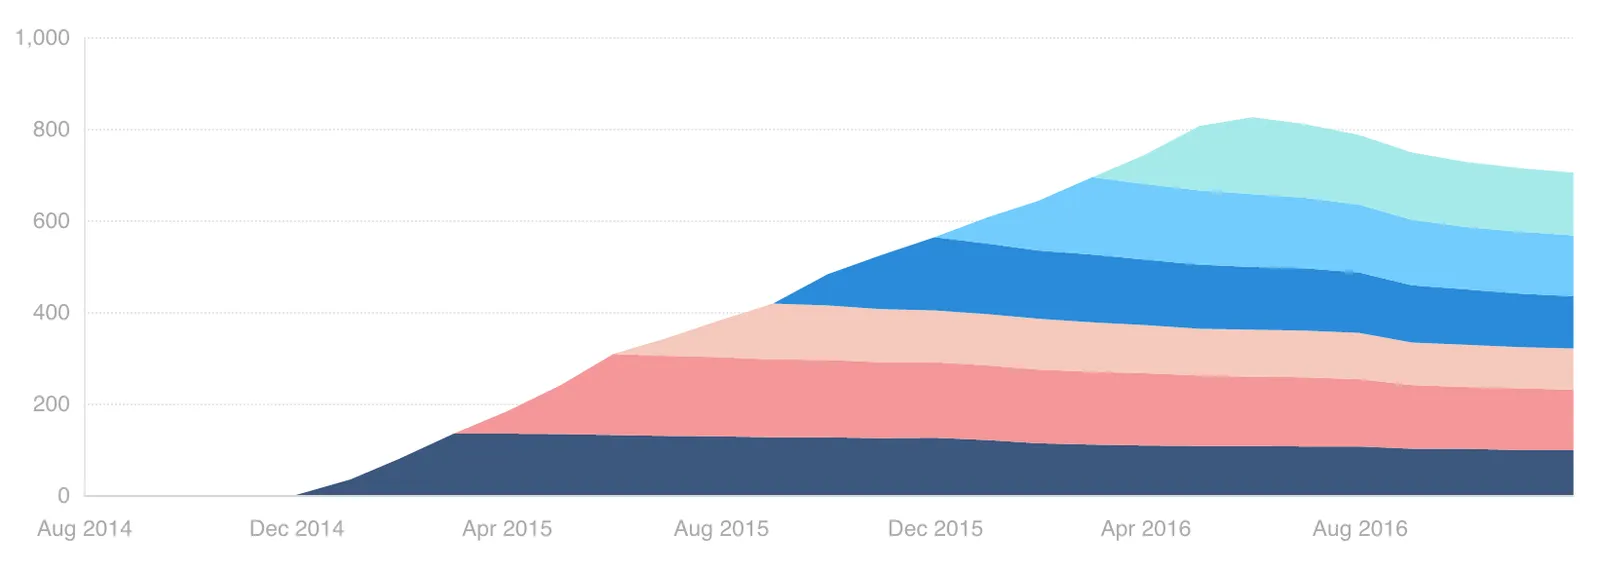
Also with February's product update, ChartMogul customers were given flexibility of choice between line, bar or stacked area charts like this one:
Also:
March
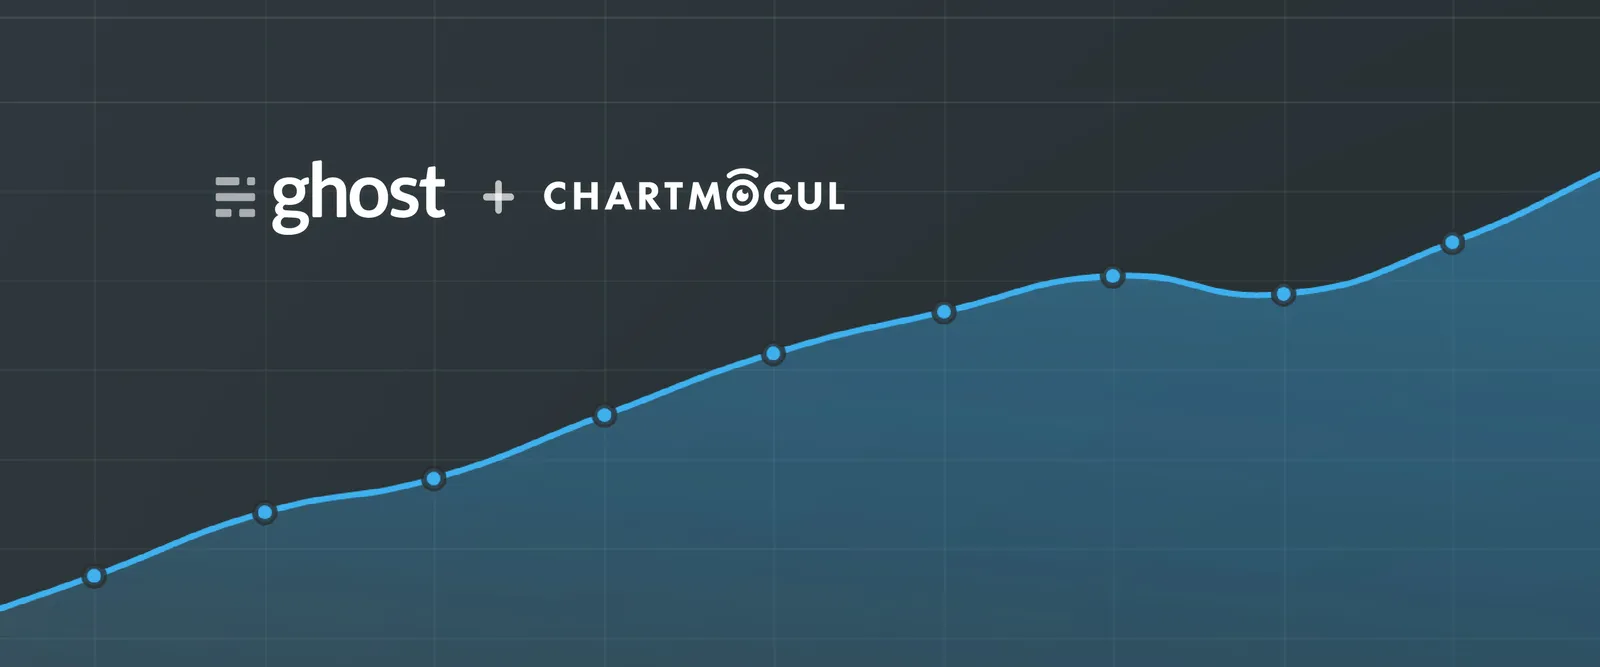
In March we were proud to share the story of ghost -- specifically how the non-profit publishing platform is using ChartMogul to publicly share its metrics and growth:
“When just getting started, with limited money in the bank and not yet profitable, metrics were everything. Life or death.” ~ John O'Nolan, CEO of Ghost
Also:
- We published a follow-up to our most popular blog post of all time: SaaS landing pages in 2017: Our analysis of 100+ top businesses
- We launched an integration with Visible and an add-on for WHCMS
April

April saw the launch of our Zuora integration! For the first time, Zuora customers could connect their data to ChartMogul.
Also:
- We explored what a $4K DSLR can teach you about SaaS onboarding
- We shared an in-depth discussion about API-based SaaS with Zapier CEO Wade Foster
May
In may we spoke to Arun Mani, MD of Continental Europe for Freshworks (formerly Freshdesk). Arun shared his insights into expanding a SaaS business into Europe, as well as his philosophy on personal growth and development. Read more here.
Also:
- We highlighted a growing problem with data literacy in business, with the post The data literacy shortfall: Are we data-driven, or data-duped?
June
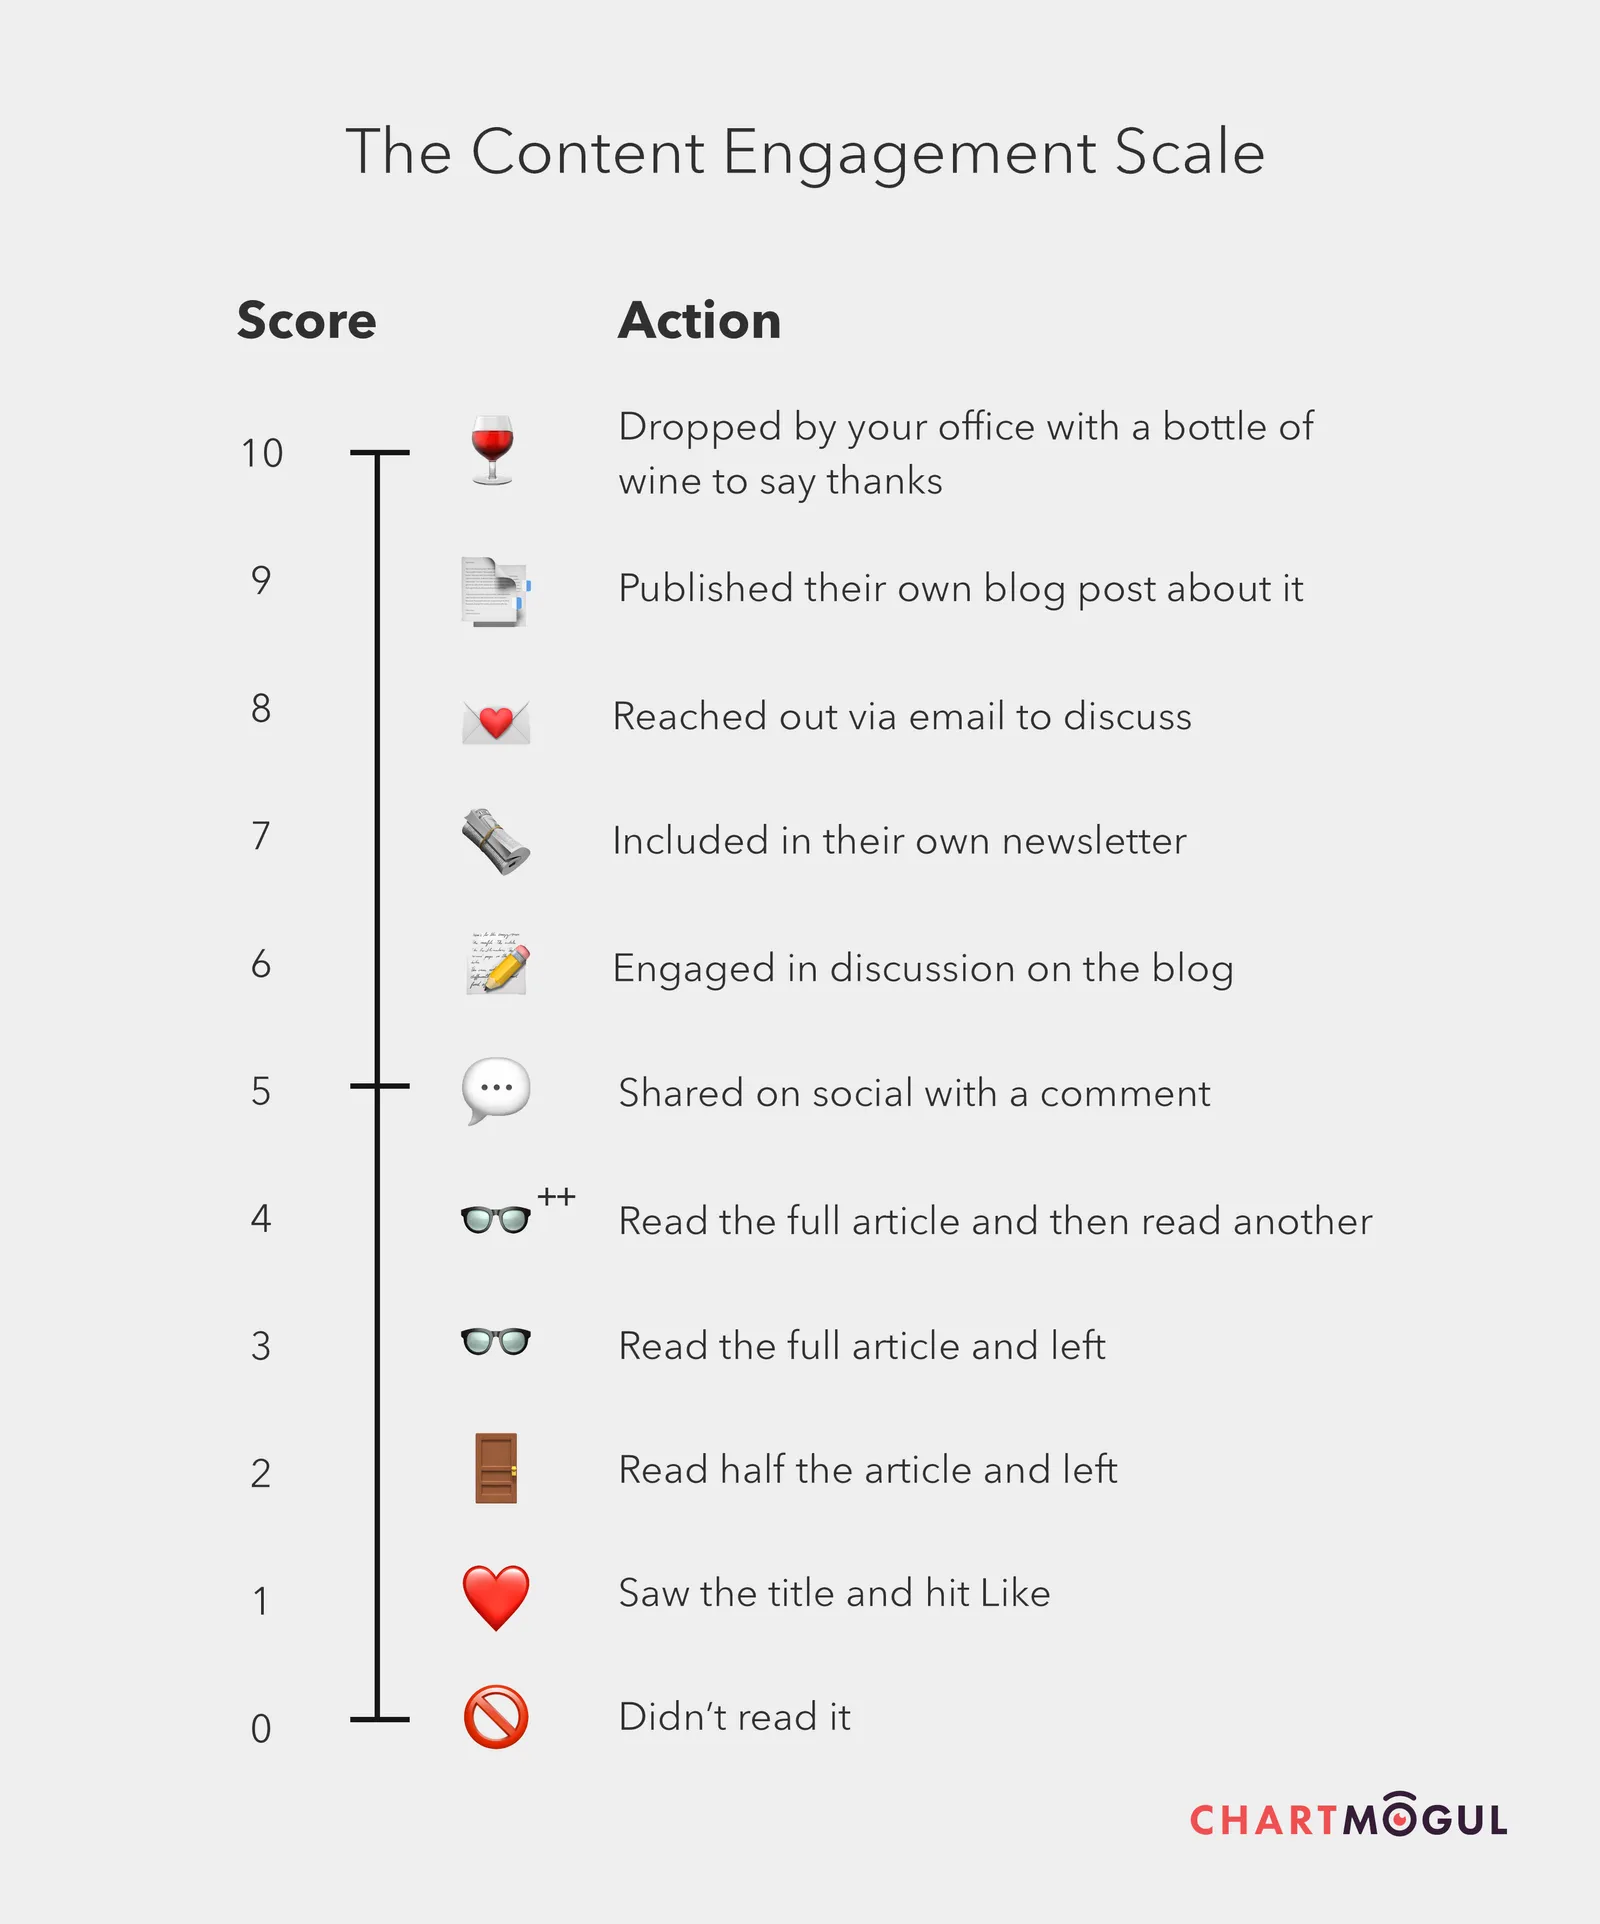
How we measure content at ChartMogul saw us share our philosophy towards content marketing at ChartMogul, particularly how we measure the success of content.
Also:
- We continued our campaign for better data literacy in business, with The Ultimate Data Literacy Cheat Sheet. As always, you can download it for free from our resources page!
July
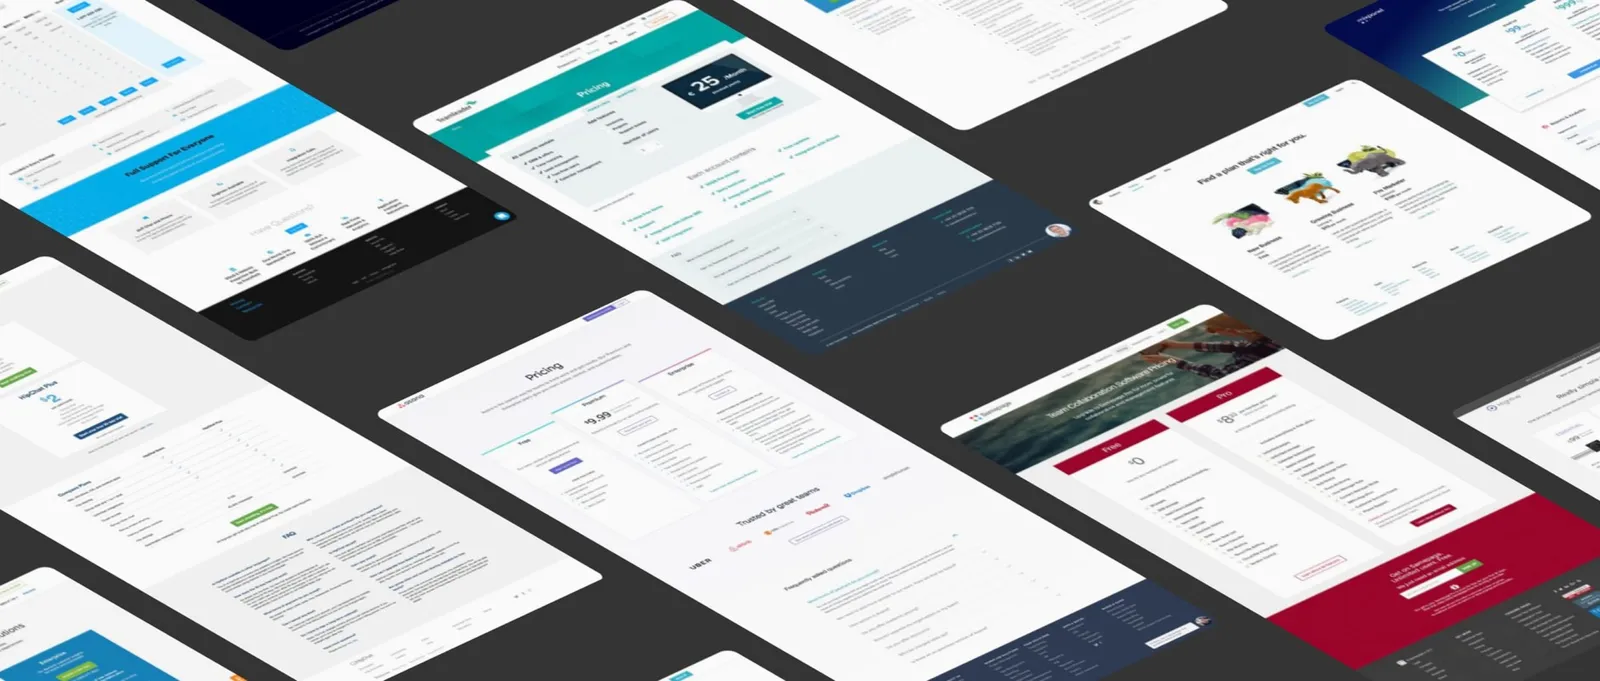
I revisited my original 2015 analysis of SaaS pricing pages with the post B2B SaaS pricing pages in 2017: Lessons from 100+ top businesses. This analysis was even bigger, covering over 100 pricing pages from SaaS businesses of all shapes and sizes.
Also:
- We announced our partnership and integration with Brazilian payment platform Vindi
- David Cancel, CEO of Drift chatted to us about his product-focused vision for chat bots, metrics and mentorship in the SaaS industry
August

ChartMogul Founder and CEO Nick Franklin shared some updated thoughts on Berlin as a home for SaaS startups, after originally sharing his impressions 3 years prior. Check out Starting a SaaS in Berlin – 3 years in.
On the product side, we began the rollout of a large backend project to improve performance of ChartMogul at scale, leading to a performance increase of 500x for a lot of charts!
Also:
- We joined the discussion on all-in-one SaaS platforms, and whether they're truly compatible with SMBs
September
By most measurements, September was the busiest month of the year.
First of all, we released ChartMogul revenue recognition! We were excited to get this into the hands of finance teams, letting them save countless hours preparing income statements and giving them a real-time view of GAAP revenues.
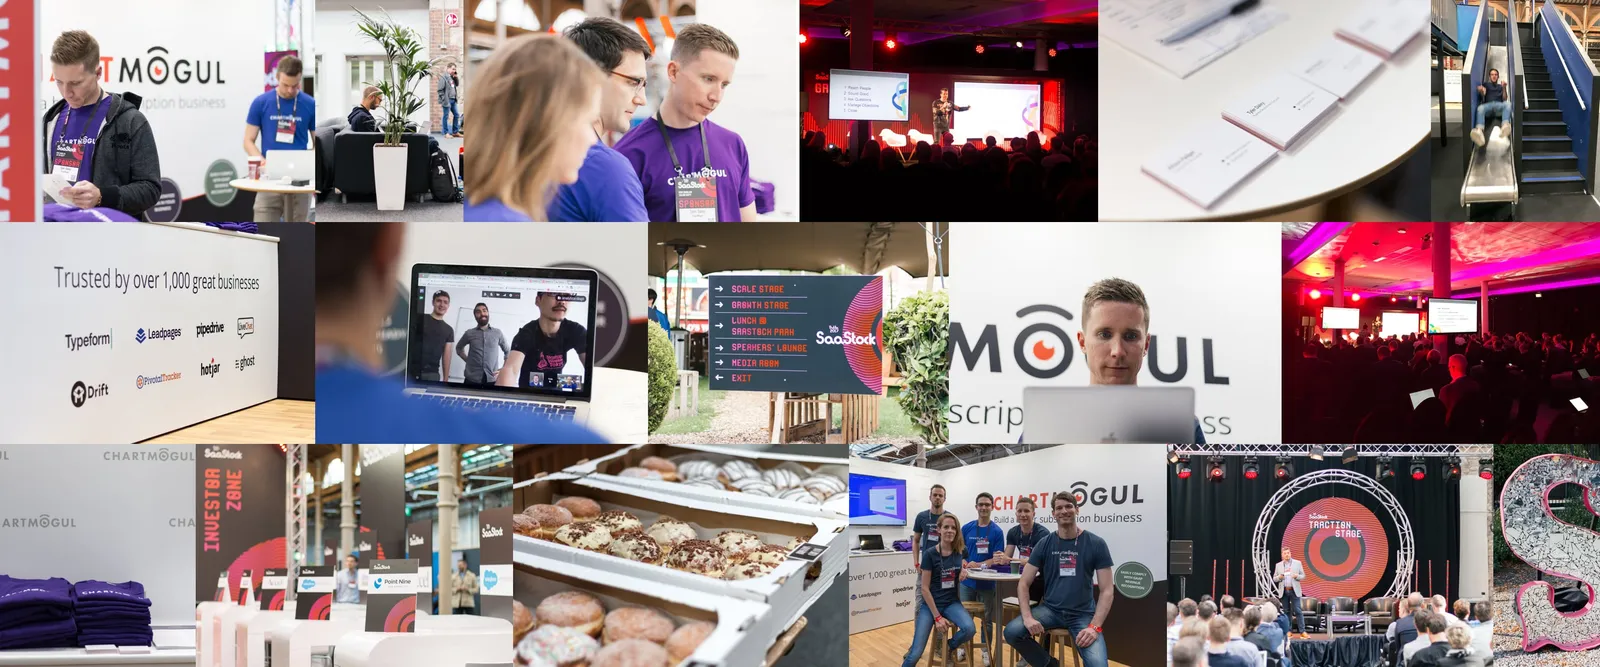
Secondly, the team was in Dublin for the SaaStock 2017 conference. See our photo journal here, and a transcript of my talk, How to build a highly-engaged SaaS audience.
Finally, the team managed to escape for a few days next to a lake in rural Germany for a company offsite. What an awesome way to recharge... and pick up some painful bruises, thanks to various competitive sports:

October
We published a profile of Mac app subscription service SetApp who's aiming to fill a gap in support for consumer subscriptions on Apple's platform. Read How the ‘Netflix for Mac apps’ plans to beat Apple at subscriptions
We also launched our guide to SaaS revenue recognition under the new ASC 606 guidelines which take effect in 2018.
November
November was a big one for both us and our customers. Firstly, we announced a new round of funding to help us build out our plans for ChartMogul in 2018 and beyond.
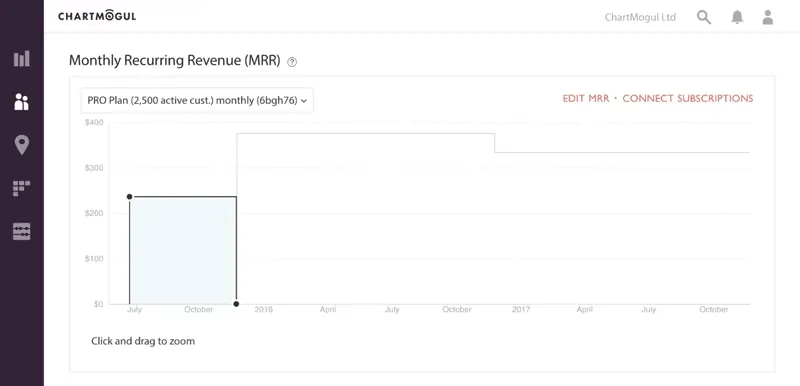
Then, we launched the ability to manually edit MRR data in ChartMogul!
Also:
- We announced our integration with Billforward
- We took a look at the rise in bootstrapped SaaS startups in Bootstrappers: SaaS startups finding their own route to $1M+ ARR
December

In December our weekly newsletter SaaS Roundup saw its 100th edition -- a great time to take a look back at some learnings in the post What I’ve learned sending 100 weekly newsletters.
How ChartMogul helps Sellbrite optimize their SaaS pricing
From the entire team at ChartMogul, we wish all of you a joyful and relaxing holiday season. See you in the new year!